
The Ten Steepest Slopes on the S&P 100: 11.6% a year against an index fund's 9.3%, and a 30% worst loss against 56%
The short version
| What it does | Holds up to ten of the largest US companies, the ones whose 125-day average price is climbing fastest. It only does so while the S&P 500 is above its own 200-day average, and sells everything when it drops below. |
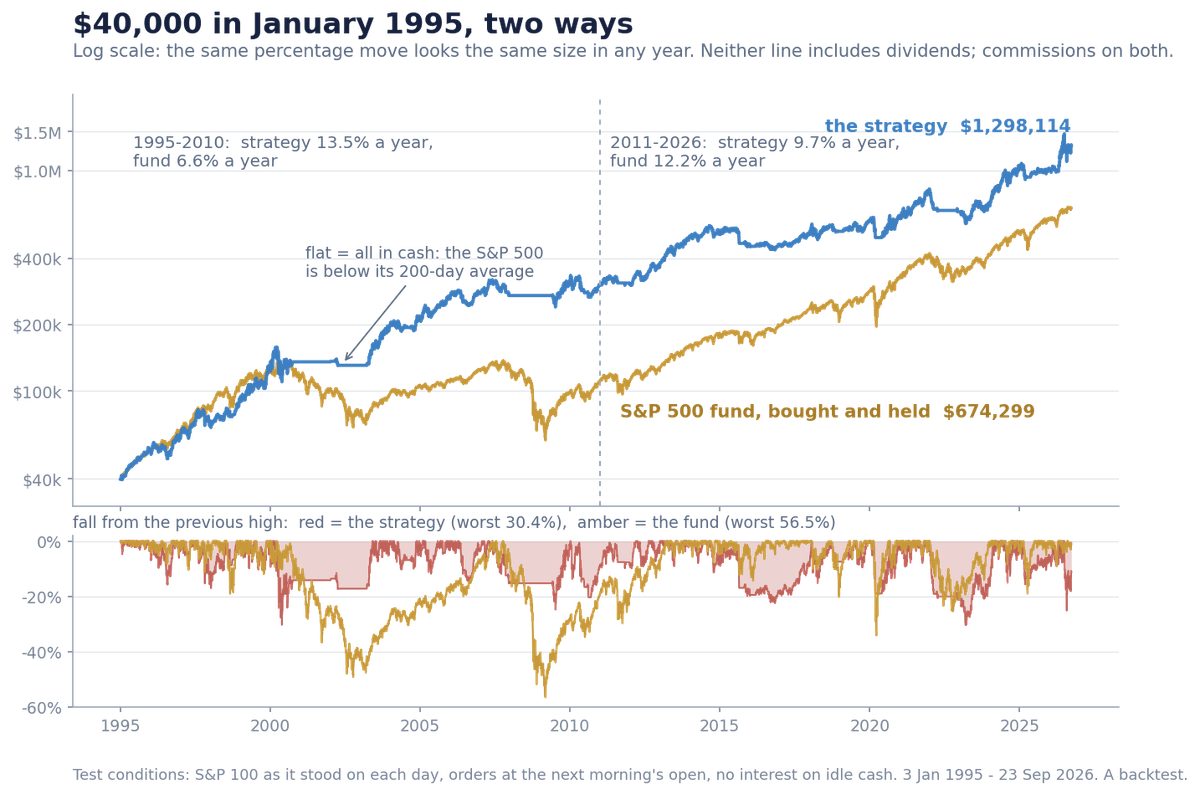
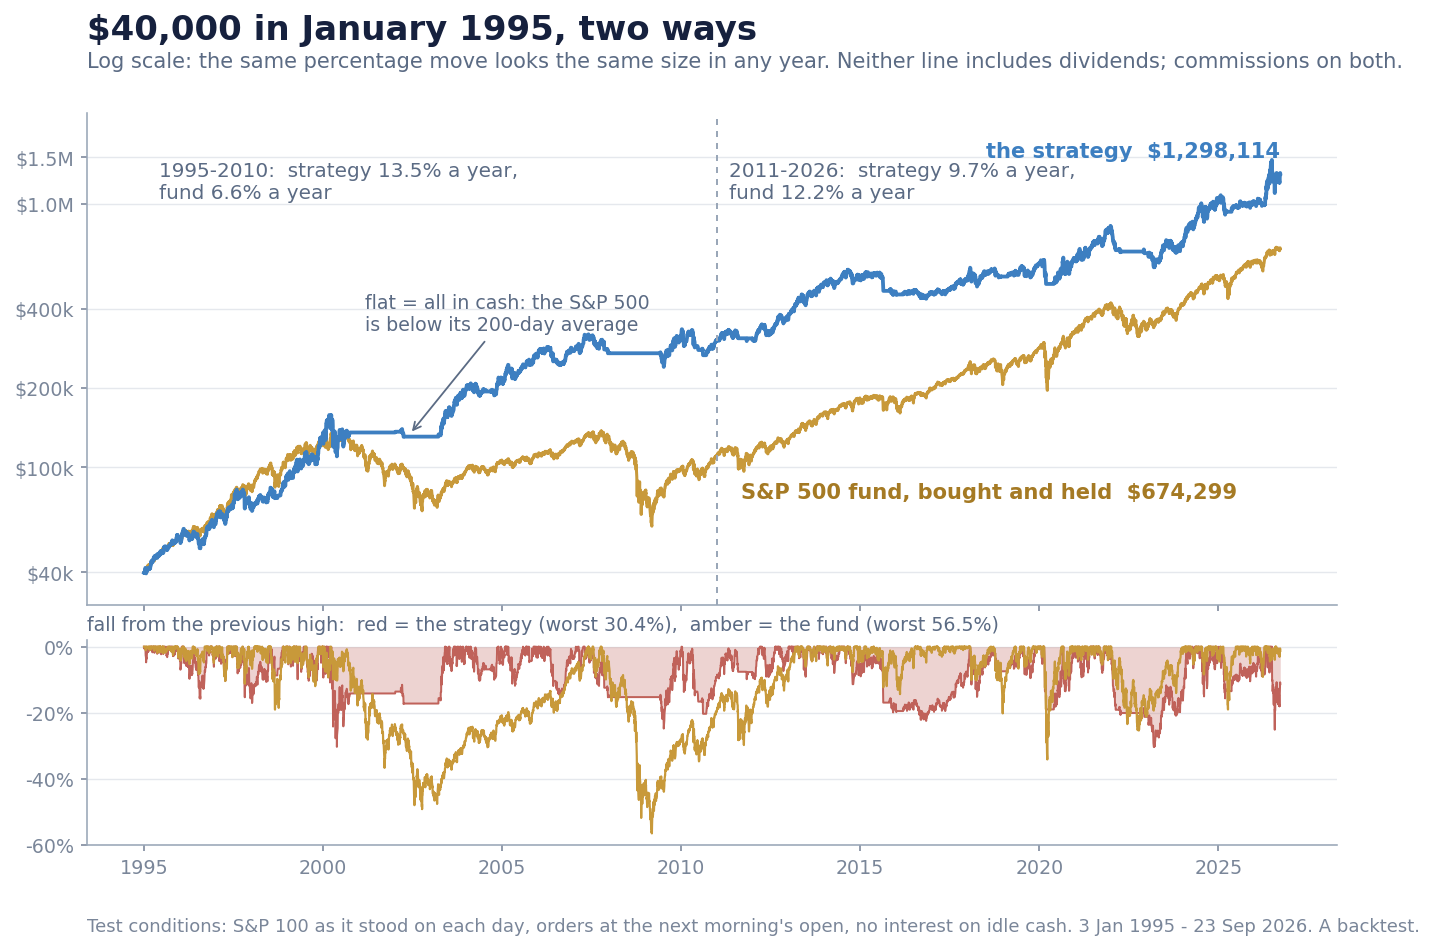
| What it made | 11.61% a year over 31.72 years, against 9.31% a year for an S&P 500 index fund bought and held. Neither figure includes dividends. |
| What it cost | At its worst it was 30.35% below its previous high, in 2021–2023. The index fund's worst was 56.48%. |
| How invested it was | About three quarters of the money on an average day. On one day in four it held nothing at all. |
| The test that mattered | I rebuilt it 300 times with the stocks picked by dice. Not one of the 300 did as well. |
| The catch | The whole lead was built before 2011, mostly by sitting out two crashes. Since then the index fund has made 12.19% a year against its 9.70%. |
Everything below is a backtest of my own rules on past prices. It is a record of what I measured, not advice and not a recommendation to trade anything.
What this is, and what it isn't
The Ten Steepest Slopes is a trend-following strategy: a bet that a stock which has been climbing steadily will keep climbing for a while. It trades the S&P 100, a hundred of the largest US companies, as the index really stood on each day. For every stock it asks one question: is the average of its last 125 closing prices higher than it was 25 trading days ago? The ten whose average is rising fastest get the money.
On top of that sits a market filter. When the S&P 500 closes below its own 200-day average, the strategy sells everything and waits. I call the filter "on" while the S&P 500 is above its average and buying is allowed, and "off" when it is below.
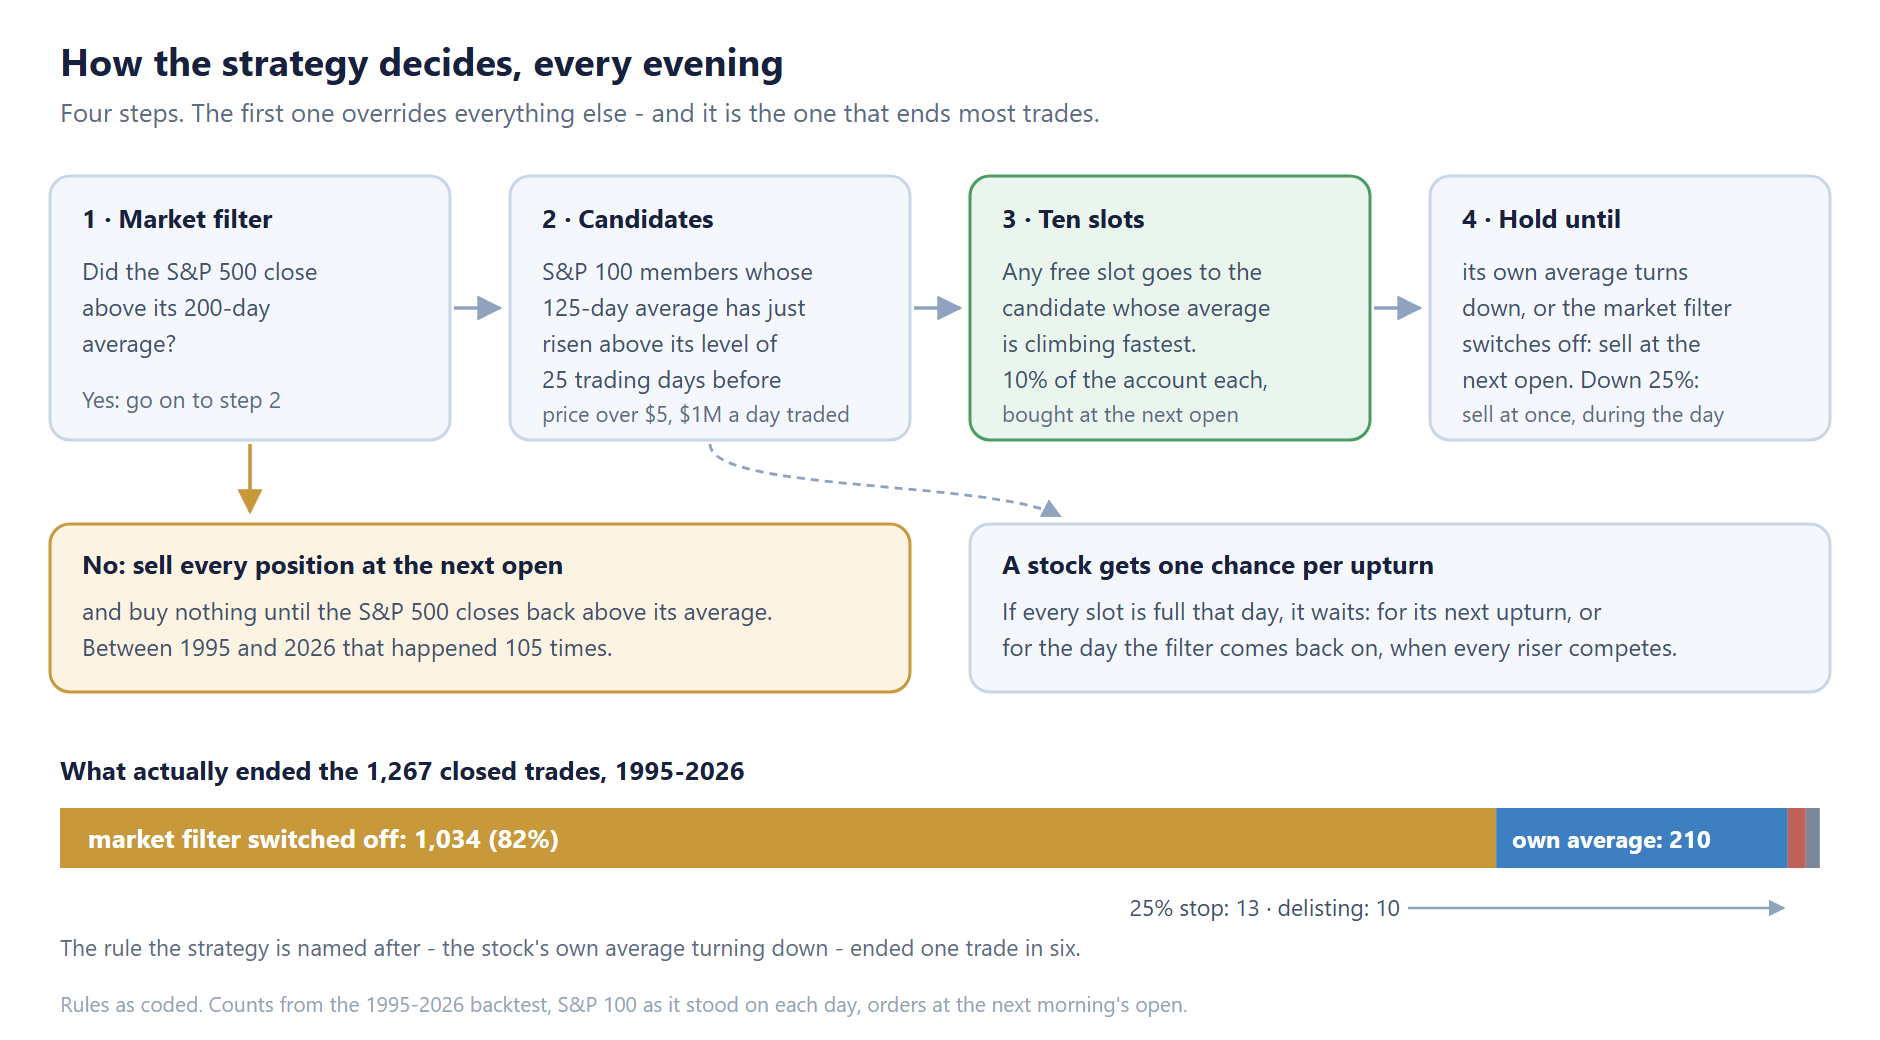
That filter turned out to do most of the selling. Of the 1,267 trades that closed, 1,034 ended because the filter switched off. Only 210 ended the way the name suggests, with the stock's own average turning down.
The "worst loss" is called drawdown: the deepest fall from a peak in the account to the low that follows. This one was about half the index fund's. But it is not a way to beat the market every year. It finished ahead in 17 of the 32 calendar years, counting 2026 so far. It won overall by being out of the market for most of the two big crashes, 2000–2002 and 2008.
The rules
Every evening it checks the S&P 500. If it closed below its 200-day average, every position is sold at the next morning's open and nothing is bought. If it is above, the strategy looks for S&P 100 stocks whose 125-day average has just risen above its level of 25 trading days earlier. Free slots go to the candidates whose average is climbing fastest. There are ten slots of 10% of the account each, bought at the next open. A position is held until its own average turns down or the filter switches off, and either one sells at the next open. A fall of 25% from the buy price sells at once.
The rules in full, precise enough to rebuild
- What it can buy. The S&P 100 as it really stood each day, including companies later dropped or delisted. Price above $5, and more than $1 million traded a day on average over the last 21 days.
- The trend gauge. The simple average of the last 125 closing prices, compared with its own value 25 trading days earlier. Higher means rising.
- When it can buy at all. The S&P 500 closed above its 200-day average. The code reads the index a day late: an order for Monday's open depends on Thursday's close, not Friday's.
- The candidates. A stock becomes a candidate on the first evening its average is rising after it was last sold, or on the evening the filter comes back on. If every slot is full that day, it gets no second chance until its average turns down and back up, or the filter switches off and on again. The four-line original does not say this. It comes from how the backtesting platform treats a signal that stays on for weeks, and the stress table shows what reading the rule literally does.
- Choosing between them. The candidate whose average rose most over the 25 days, in percent, gets a slot first.
- Size. Ten slots, each 10% of the account at the time of buying. Nothing is ever borrowed.
- Selling, whichever comes first. The average closes below its level of 25 days earlier: sell at the next open. The S&P 500 closes below its 200-day average: sell everything at the next open. The price falls 25% below the buy price: sell at that level during the day, or at the open if it opens below it.
- Costs. Commission of half a cent a share. The test adds no slippage, the gap between the price you expect and the one you get, and pays nothing on idle cash. Prices are adjusted for splits but not for dividends.
One real trade, start to finish
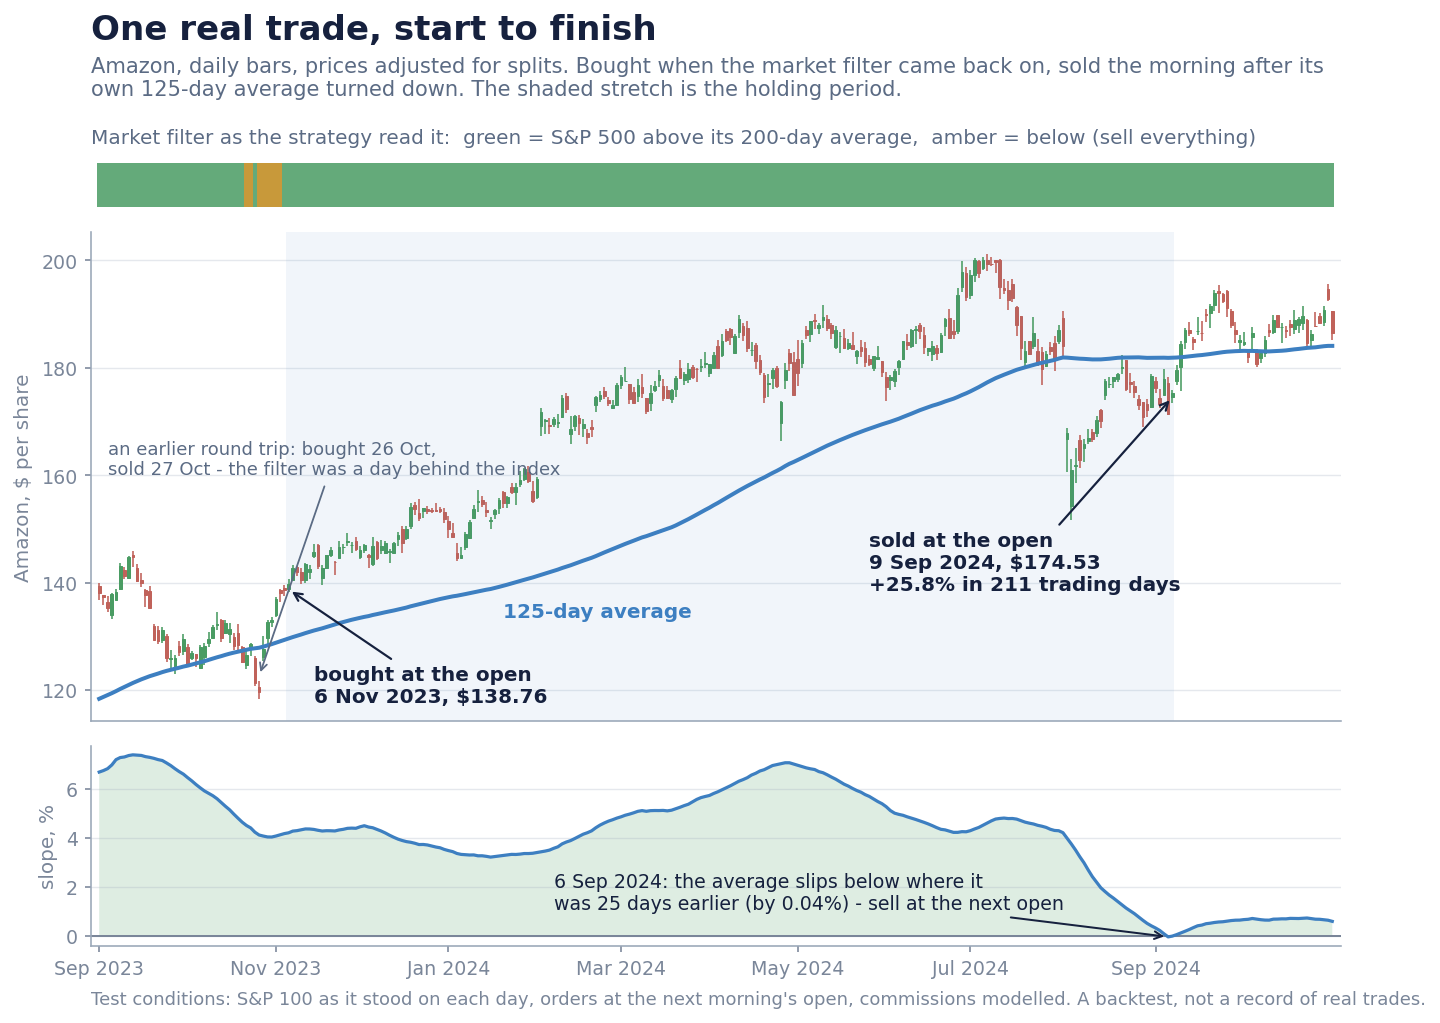
On 2 November 2023 the S&P 500 closed back above its 200-day average after six sessions below it. The filter reads the index a day late, so the buy orders went in for Monday 6 November. The strategy held nothing, every rising S&P 100 stock was a candidate, and the ten steepest got a slot. One was Amazon, bought at the open at $138.76.
The filter then stayed on for sixteen months. Amazon's average kept climbing until 6 September 2024, when it slipped 0.04% below its level of 25 trading days before. That was enough. It sold at the next open, on 9 September, at $174.53: up 25.77% in 211 trading days. A day later its average was rising again, but the slot had already gone to another stock.
Two details show how the strategy really behaves. Amazon had been bought once before, on 26 October, together with nine others, although the S&P 500 had closed below its average the evening before. The filter was a day behind, so it bought all ten, and it sold all ten the next morning. And three of the other stocks bought on 6 November never saw their own averages turn down. The market filter sold Nvidia, Meta and Broadcom on 12 March 2025, each up between 99% and 152%.
What it did over 31 years
The S&P 100 with its real historical membership, 3 January 1995 to 23 September 2026. $40,000 to start, ten slots of 10%, half a cent a share in commission, orders at the next open, 1,277 trades. No dividends and no interest on idle cash. The comparison is an S&P 500 index fund bought on day one and never sold, with the same money and commission. A backtest, not a live track record.
| Over the full 31.72 years | The strategy | Index fund, bought and held | Same fund, with the market filter |
|---|---|---|---|
| $40,000 became | $1,298,114 | $674,299 | $429,610 |
| Return a year | 11.61% | 9.31% | 7.77% |
| Worst loss from a peak | 30.35% | 56.48% | 23.81% |
| Sharpe ratio | 0.74 | 0.57 | 0.68 |
| Money at work, average day | 74.5% | 100% | 75.7% |
Sharpe compares the return with how bumpy the ride was: higher means the same gain arrived more smoothly. The last column applies the market filter to the index fund itself.
| Era | Strategy | Index fund | Same fund, filtered |
|---|---|---|---|
| 1995–1999 | +27.19% | +26.37% | +22.55% |
| 2000–2002 | −0.44% | −15.62% | −5.19% |
| 2003–2007 | +15.67% | +10.70% | +5.09% |
| 2008–2009 | +7.82% | −12.69% | +7.21% |
| 2010–2019 | +6.50% | +11.19% | +6.11% |
| 2020–2026 | +12.41% | +13.79% | +8.34% |
The bear markets built the lead. The strategy held nothing at all for the whole of 2001 and the whole of 2008. Its account has been ahead of the fund on every trading day after 11 August 2000. From 2010 on, the fund did better in both periods.
One more thing the headline hides. Ten positions bought on 10 April 2026 were still open at the end and had made $310,390, a quarter of all the profit in 31 years. Measured to the end of 2025, the return was 10.95% a year.
What I tried to break
Every run is in the table below, including the ones that beat my own defaults. "Money at work" is the average share of the account invested. MAR is the return a year divided by the worst loss, so higher is better. A basis point is one hundredth of one percent of the price.
The full stress battery: 42 rows, 30 runs plus two benchmarks
| Group | Variant | Return a year % | Worst loss % | MAR | Trades | Winners % | Money at work % |
|---|---|---|---|---|---|---|---|
| Baseline | the baseline run | 11.61 | 30.35 | 0.38 | 1,277 | 46.4 | 74.5 |
| Market filter | switched off | 8.41 | 51.31 | 0.16 | 602 | 41.7 | 94.7 |
| Market filter | reads the S&P 100 index (the code's own default) | 12.33 | 28.94 | 0.43 | 1,237 | 44.5 | 74.2 |
| Market filter | 100-day average | 10.02 | 49.18 | 0.20 | 1,886 | 48.8 | 71.5 |
| Market filter | 150-day average | 10.99 | 32.37 | 0.34 | 1,703 | 45.8 | 73.4 |
| Market filter | 200-day average (default) | 11.61 | 30.35 | 0.38 | 1,277 | 46.4 | 74.5 |
| Market filter | 250-day average | 10.97 | 30.14 | 0.36 | 1,158 | 44.6 | 75.9 |
| Length of the stock's average | 75 days | 9.36 | 23.32 | 0.40 | 1,413 | 46.4 | 74.1 |
| Length of the stock's average | 100 days | 10.59 | 30.11 | 0.35 | 1,310 | 47.3 | 74.5 |
| Length of the stock's average | 125 days (default) | 11.61 | 30.35 | 0.38 | 1,277 | 46.4 | 74.5 |
| Length of the stock's average | 150 days | 12.02 | 30.14 | 0.40 | 1,223 | 46.9 | 74.9 |
| Length of the stock's average | 200 days | 13.55 | 29.94 | 0.45 | 1,157 | 48.4 | 74.9 |
| Slope measured over | 10 days | 12.69 | 34.06 | 0.37 | 1,373 | 47.2 | 74.6 |
| Slope measured over | 15 days | 11.07 | 32.43 | 0.34 | 1,334 | 45.8 | 74.5 |
| Slope measured over | 25 days (default) | 11.61 | 30.35 | 0.38 | 1,277 | 46.4 | 74.5 |
| Slope measured over | 50 days | 11.53 | 29.40 | 0.39 | 1,215 | 46.8 | 74.5 |
| Slope measured over | 100 days | 11.21 | 32.41 | 0.35 | 1,180 | 46.2 | 74.7 |
| Disaster stop | 15% | 11.59 | 34.17 | 0.34 | 1,355 | 46.4 | 74.6 |
| Disaster stop | 20% | 11.77 | 30.67 | 0.38 | 1,289 | 47.1 | 74.5 |
| Disaster stop | 25% (default) | 11.61 | 30.35 | 0.38 | 1,277 | 46.4 | 74.5 |
| Disaster stop | 35% | 11.54 | 30.96 | 0.37 | 1,263 | 46.4 | 74.5 |
| Disaster stop | none | 11.54 | 30.96 | 0.37 | 1,262 | 46.4 | 74.5 |
| Positions | 5 of 20% | 16.01 | 35.21 | 0.46 | 624 | 47.8 | 74.9 |
| Positions | 10 of 10% (default) | 11.61 | 30.35 | 0.38 | 1,277 | 46.4 | 74.5 |
| Positions | 20 of 5% | 9.30 | 26.65 | 0.35 | 2,540 | 45.9 | 74.3 |
| Who gets a free slot | steepest average first (default) | 11.61 | 30.35 | 0.38 | 1,277 | 46.4 | 74.5 |
| Who gets a free slot | flattest average first | 7.01 | 29.06 | 0.24 | 1,421 | 46.3 | 73.4 |
| How the buy rule is read | one chance per upturn (default) | 11.61 | 30.35 | 0.38 | 1,277 | 46.4 | 74.5 |
| How the buy rule is read | any rising stock, on any day | 12.88 | 30.73 | 0.42 | 1,242 | 49.0 | 75.6 |
| Slippage each way | none (default) | 11.61 | 30.35 | 0.38 | 1,277 | 46.4 | 74.5 |
| Slippage each way | 1 basis point | 11.52 | 30.47 | 0.38 | 1,277 | 46.4 | 74.5 |
| Slippage each way | 3 basis points | 11.36 | 30.70 | 0.37 | 1,277 | 46.0 | 74.5 |
| Slippage each way | 5 basis points | 11.20 | 30.92 | 0.36 | 1,277 | 45.7 | 74.5 |
| Slippage each way | 10 basis points | 10.81 | 31.48 | 0.34 | 1,277 | 44.6 | 74.5 |
| Fills | next open (default) | 11.61 | 30.35 | 0.38 | 1,277 | 46.4 | 74.5 |
| Fills | next close | 10.88 | 28.36 | 0.38 | 1,277 | 47.1 | 74.5 |
| Universe | S&P 100 as it stood (default) | 11.61 | 30.35 | 0.38 | 1,277 | 46.4 | 74.5 |
| Universe | S&P 500 as it stood | 11.17 | 54.29 | 0.21 | 1,346 | 48.1 | 75.5 |
| Universe | Nasdaq 100 as it stood | 14.49 | 59.88 | 0.24 | 1,342 | 48.0 | 74.8 |
| Universe | today's S&P 100 list | 18.05 | 31.82 | 0.57 | 1,216 | 49.8 | 74.5 |
| Benchmark | S&P 500 fund, bought and held | 9.31 | 56.48 | 0.17 | 1 | 100.0 | 100.0 |
| Benchmark | the same fund, with the market filter | 7.77 | 23.81 | 0.33 | 106 | 47.2 | 75.7 |
The dice test, the run that could have killed it. Here the day of buying is hardly a choice. A slot opens, usually because the filter has just come back on, and it is filled the next morning. The real choice is which stocks. So I built placebos: versions where that choice is made by dice.
The first set, 200 runs, keeps every rule, candidate, exit, slot and cost. Only the pick among the candidates is left to the dice. The second set, 100 runs, drops the trend rule altogether: the dice pick any S&P 100 stock while the filter is on, and hold it until the filter switches off.
| What picked the stocks | Middle run | Best run | Worst loss of the middle run |
|---|---|---|---|
| Dice, among the real candidates (200 runs) | 7.93% | 10.65% | 27.82% |
| Dice, any S&P 100 stock (100 runs) | 7.10% | 9.76% | 31.09% |
| The real rule: steepest first | 11.61% | 30.35% |
Not one of the 300 matched the real rule. The trend rule alone adds little: 7.93% for the middle run against 7.10% for dice choosing any stock. What earns the return is the ranking. Give the slot to the slowest riser instead of the fastest and it makes 7.01% a year, below the middle dice run.
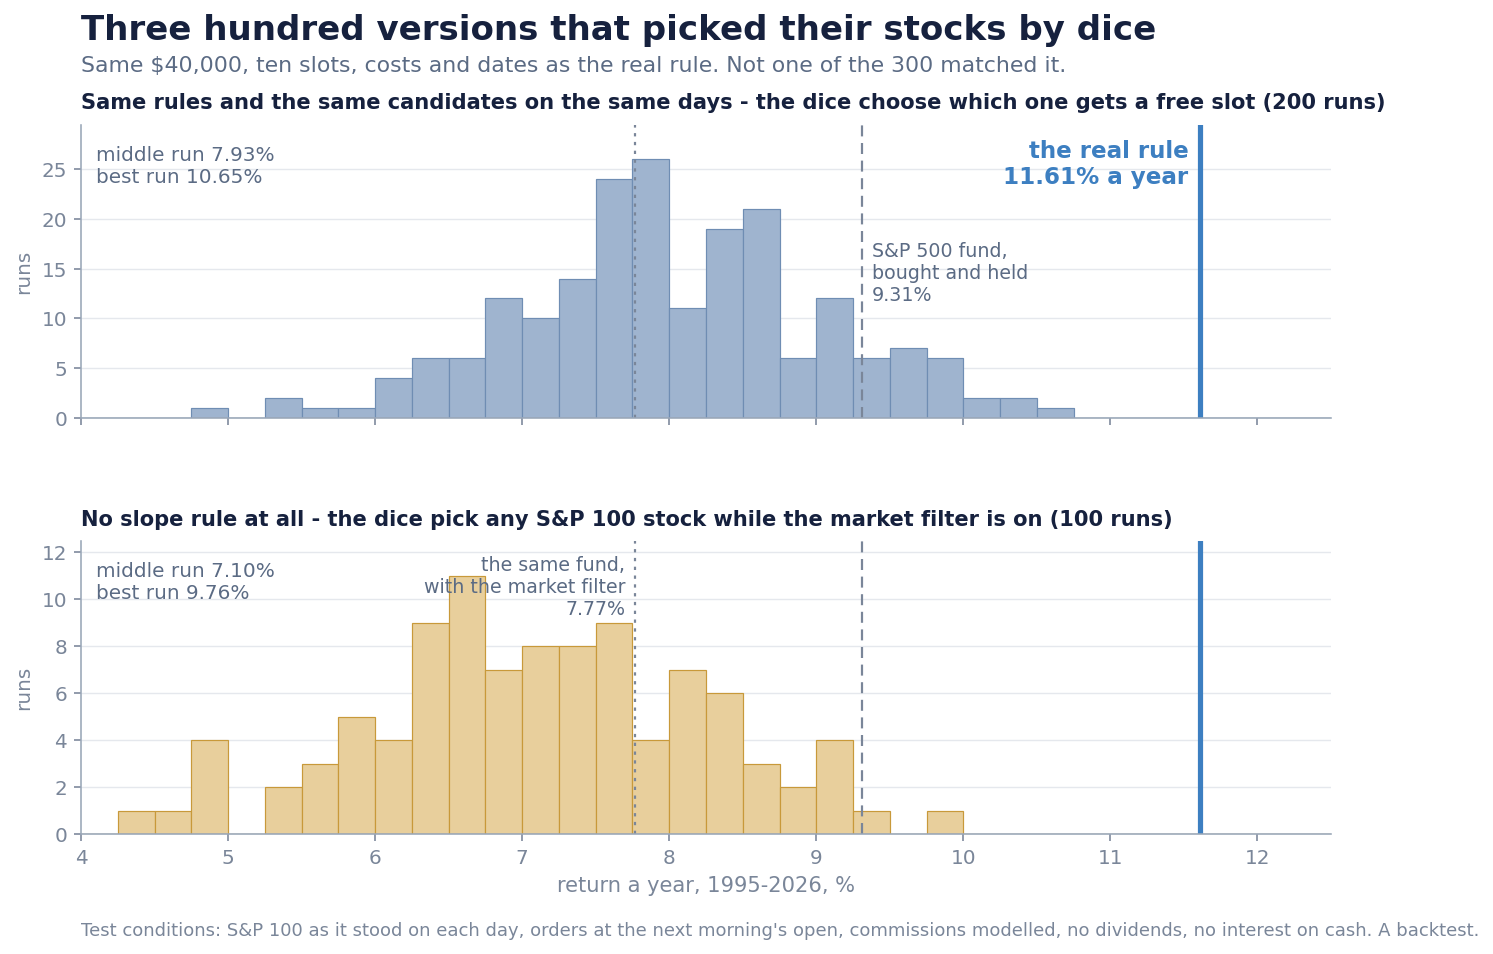
The filter, meanwhile, is a cost on return alone. The index fund with the filter made 7.77% a year against 9.31% held straight through, and 276 of the 300 dice runs finished below the plain fund. What the filter buys is a smaller worst loss: 23.81% against 56.48%.
Two more results change the picture. Read literally, so that any rising stock can take a free slot on any day, the rule makes 12.88% a year on a 30.73% worst loss. Two honest people coding the four-line original could easily get different answers. And the code's own default filter reads the S&P 100 index, not the S&P 500 used in this review. That version makes 12.33% on 28.94%.
What survives
The ranking carries real information. None of 300 dice runs reached the real 11.61% a year, and the best made 10.65%. Reversed, the ranking makes 7.01%.
The settings are not on a knife edge. Averages from 100 to 200 days made between 10.59% and 13.55% a year, and 125 is not the best of them. A slope measured over 10 to 100 days lands between 11.07% and 12.69%. The 25% stop fired 13 times in 31 years; removing it cost 0.07 of a point.
Costs are not the weak spot. Each basis point lost on every order costs about 0.08 of a point a year: 11.61% with none, 10.81% at ten. These are among the most traded shares in the world.
The filter did its job in the long bear markets. −0.44% a year through 2000–2002 while the fund lost 15.62%, and +7.82% through 2008–2009 against −12.69%.
What breaks
The advantage is old. Since 2011 the fund has made 12.19% a year against 9.70%. In 2022 the filter did not help: the strategy lost 20.22% in the year, the fund 19.48%. Its worst loss ran from 27 December 2021 to 13 March 2023, and it took until 1 March 2024 to recover.
Today's list would flatter it by 6.44 points a year. Run on the stocks in the S&P 100 today, the same rules make 18.05% a year. Today's list is a list of winners chosen afterwards, and a rule that buys the fastest risers finds them.
A bigger pool is not safer. On the S&P 500 the same rules lost 54.29% in the spring of 2000, and on the Nasdaq 100 59.88%, both in under three months. The S&P 500 dipped below its average only for a day or two at a time that spring, so the filter kept buying back the fastest risers as they collapsed.
Fewer, bigger positions look better and hurt more. Five slots of 20% make 16.01% a year on a 35.21% worst loss; twenty slots of 5% make 9.30% on 26.65%.
The filter makes it busy. It sold everything it held 105 times in 31 years. Half of all trades lasted nine trading days or fewer. A faster, 100-day filter makes it worse: the worst loss grows to 49.18%.
Verdict
This suits someone who wants to own large US companies with a rule that steps aside in long bear markets, and who can live with trailing the index for years in between. The stock selection is real: the steepest risers beat dice in all 300 runs. But the lead over an index fund came from two bear markets, and the last fifteen years belong to the fund.
It does not suit anyone who wants to beat the index in a bull market, or who would test it on today's index members and believe the 18.05%. Nor anyone who expects the filter to catch every fall. It did not help in 2022, and it did not help the wider-pool versions in 2000.
More reviews like this one, with the formulas behind them, are on my Patreon: patreon.com/cw/SimpleStockTrade
Sources — every number traceable
Every figure in the text comes from one of the runs below, and each one records the conditions it was run under.
What each number came from
- The baseline run. The full trade list, all 1,277 trades, and the account value and money at work for every one of the 7,984 trading days. The eras, the calendar years and the idle-cash check are all worked out from that daily curve.
- The benchmarks. An S&P 500 index fund bought and held over the same window from the same starting money, and the same fund switched in and out by the market filter.
- The stress battery. Thirty runs, one for each variant in the table above, plus the two benchmarks.
- The placebos. 200 runs with dice picking among the real candidates, and 100 with dice picking any S&P 100 stock while the filter is on. The dice were replayed independently and checked: 63 of 63 values identical, spread evenly, with no correlation between neighbours.
- Why each trade ended. Every closed trade was classified by its exit: 1,034 by the market filter, 210 by the stock's own average, 13 by the stop and 10 by a delisting.
- The illustrated trade. Amazon's gauges recomputed bar by bar from the raw daily prices.
- Idle cash, measured and left out of the article. Paying a flat 2% a year on uninvested cash would lift the return to 12.18% a year; at 4%, to 12.75%.
Audit of the backtest. The rules were recomputed from the raw daily bars and every trade was checked against them. All 1,277 entries are at the open of the entry day, with every buy condition true the evening before. All 1,267 closed trades exit on the right day at the right price. On none of the 313 buying days did a candidate that was left out rank above one that was bought. The only entries that are not "the first rising evening since the last sale" are the ten bought on the first day of the test, when every candidate is new.
Cross-check. The figures in the article were computed from the daily equity curve by an independent script, not read off the backtest report. The two agree: the report gives 11.59% a year, a worst drawdown of 30.35%, exposure of 74.49%, 1,277 trades, 596 winners (46.67%) and 47.44 bars held on average. The script gives 11.61% (it counts a year as 365.25 calendar days), 30.35%, 74.5% and the same trade count.