
The system I trade
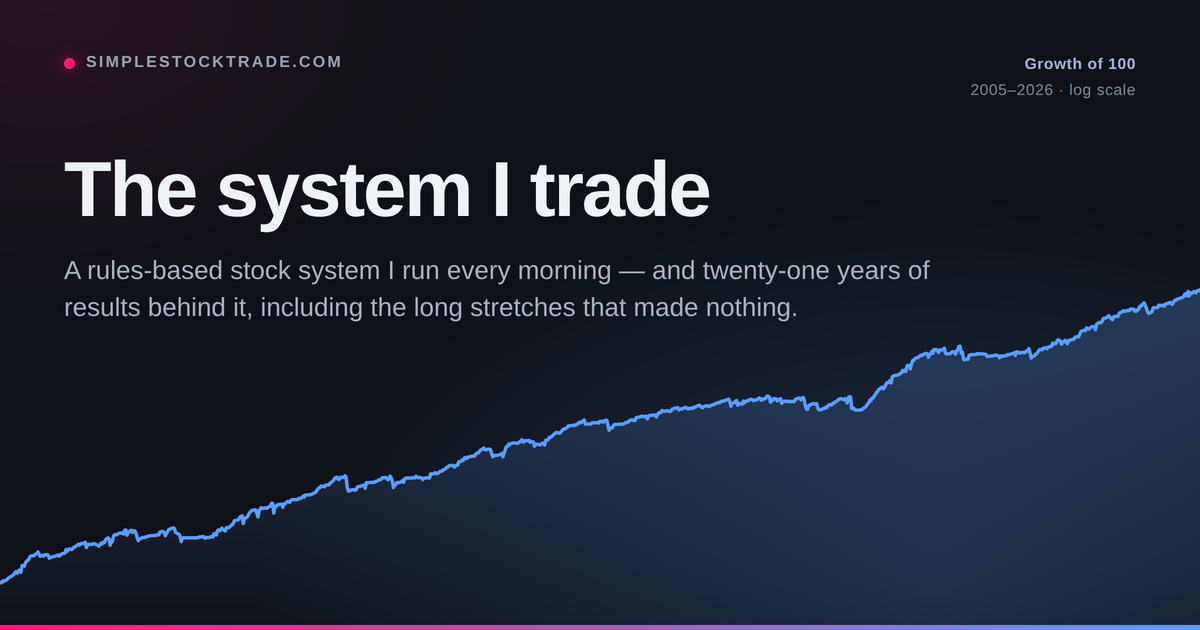
I do not pick stocks. I run a set of rules, every morning, on a list of large American companies. The rules say what to buy and when to sell. I do what they say.
The whole thing takes about ten minutes a day. Orders go out before the market opens and that’s it. The cycle repeats tomorrow 🙂
Positions are short. A typical one is held about four days. Nothing is a bet on a company; it is a bet that a pattern that has repeated for twenty years will repeat again a few hundred more times.
Track record
· long-only US equities · every number below is a simulation of the same rules I run today, on data as it stood on each day.
Growth of 100
Drag to zoom. The lower panel is the same account measured from its own high-water mark — how far below the previous peak it sat, day by day.
Year by year
Return for the calendar year, and the deepest point that year reached below its running peak. The two belong together: the bar is what you were paid, the marker is what you had to sit through to collect it.
Month by month
The deepest drawdowns
Time to the bottom is rarely the hard part. Time back to the previous high is.
What a single trade looks like
Distribution of the result of every closed trade, in per cent of the money put into it. Clipped at ±15% so the tails do not flatten the shape.
- Index membership as it stood on each day, including companies that later left the index or stopped trading — no survivorship bias.
- Orders go out the morning after the signal and fill at the market's price, never at a price chosen with hindsight. Orders that never fill cost their place in the queue.
- Commissions are charged per share with a per-order minimum and a cap, at the rates a retail account actually pays. Whole shares only.
- Not included: interest on idle cash, the financing cost of leverage, and slippage beyond the fill rules above. The first understates the result; the second and third overstate it.
What is good about it
It wins often. Two trades in three make money. Not because the wins are big — they are small, and the average loser is actually bigger than the average winner — but because winners come twice as often as losers.
Most years are good years. Nineteen of the twenty-two calendar years on the chart ended up, counting 2026, which is not over yet. The three that did not lost 8.9%, 0.9% and 7.8% — bad years, not ruinous ones.
It does not need me to be right about anything. No view on the economy, no opinion on a company, no forecast. The rules do not know what year it is.
Most months are positive. Almost three months in four end higher.
Money is not locked up. Trades are short, and on average about half of the account is invested. The rest sits in cash, waiting for a setup worth taking.
What is hard about it
The bad stretches are long. The deepest fall took about a quarter of the account, in the summer of 2011, and the bottom came in eighteen days. Getting back to the previous high took another seventeen months. The longest run below a previous high lasted 664 days, from September 2018 to July 2020. Three times it has taken between seventeen and twenty-two months to see a new high. Most people quit somewhere in month five.
Losing months are normal. About one month in four is red. Four in a row has happened once — August to November 2021, in a year that still finished 43% up. In the middle of it, it feels exactly like the system has stopped working.
You have to show up every single morning. Skipping the ugly days is how you end up with the losses and none of the wins — the good trades are not announced in advance.
Most orders do nothing. Roughly four out of five never fill. If you need action to feel productive, this is the wrong way to trade.
Past results are exactly that. These numbers come from running today’s rules over old data. They describe what happened, under the conditions listed at the bottom of the report. They are not a promise, and markets are free to stop cooperating.
The honest line
This is a journal of how I trade my own money. It is not a signal service, not advice, and not an invitation to copy anything. If you take one thing from this page, take the 664 days — not the annual number.