
I coded the highest-returning strategy in Unholy Grails. The default settings were lying.

The one idea
Most people meet Bollinger bands as a mean-reversion tool: price pokes below the lower band, you buy the dip, you wait for the snap back. Nick Radge uses them the other way round. In Unholy Grails the bands are a momentum instrument — you buy when price closes above the upper band, because a stock that has stretched two standard deviations beyond its own 100-day average is not merely rising, it is accelerating.
That inversion is the idea worth the cover price. The rest of the chapter is the part nobody copies correctly: the exit sits at a different band from the entry, and that asymmetry is doing more work than the entry rule is.
The book reports this as its highest-CAGR system. I coded the rules exactly as published and ran them on twenty years of survivorship-free US data. What came out is a lesson less about Bollinger bands than about the settings your backtest software ships with.
Who wrote it, and when
Nick Radge is an Australian trader and fund manager who has been running systematic strategies since the 1980s. Unholy Grails came out in 2012, and its whole premise is refreshingly unglamorous: take eight simple, fully-disclosed long-only systems, test them the same way, publish every number including the ugly ones, and let the reader see that dull rules beat clever ones.
The era matters less here than in most trading books, because nothing in it depends on market microstructure. It is daily bars and end-of-day decisions. What has dated is the data available in 2012 — and that turns out to be the most interesting thing in the book, for reasons we get to below.
The mechanism
Both bands are computed off the same 100-day window. Entry sits far above it; the exit sits below the mean, further out than most traders would place it.
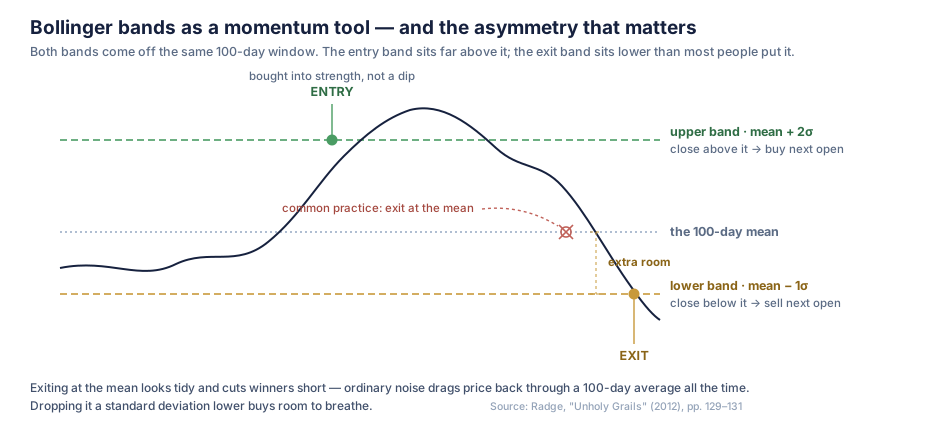
Radge is explicit about why the exit is not at the moving average, which is where convention puts it:
“the main concern with using simple moving averages is that stock markets tend to have more noise and therefore, more often than not, a simple moving average will prematurely close positions out.”
So the exit drops a full standard deviation below the mean. The position gets room to breathe through ordinary noise, and pays for it by giving back more when a trend genuinely ends. Every trade in the test I ran exits that way — there is no stop loss anywhere in this system.
The rules, exactly
- Bands: 100-day simple moving average; upper band at 3 standard deviations, lower band at 1. (Radge loosens the textbook 20-day/2σ default deliberately: “These settings are too tight for longer term momentum investing.”)
- Entry: close above the upper band → buy at the next open.
- Exit: close below the lower band → sell at the next open.
- Index filter: when the broad index is below its own 75-day average, stop taking new entries. Existing positions are left alone.
- Ranking: when more signals fire than there are slots, take the ones stretched furthest above their mean.
Here is what that looks like on a real trade the backtest took — Super Micro Computer, March 2023. The close on 21 March came in at 10.82 against an upper band of 10.24. The order went in the following morning and filled at 10.89.
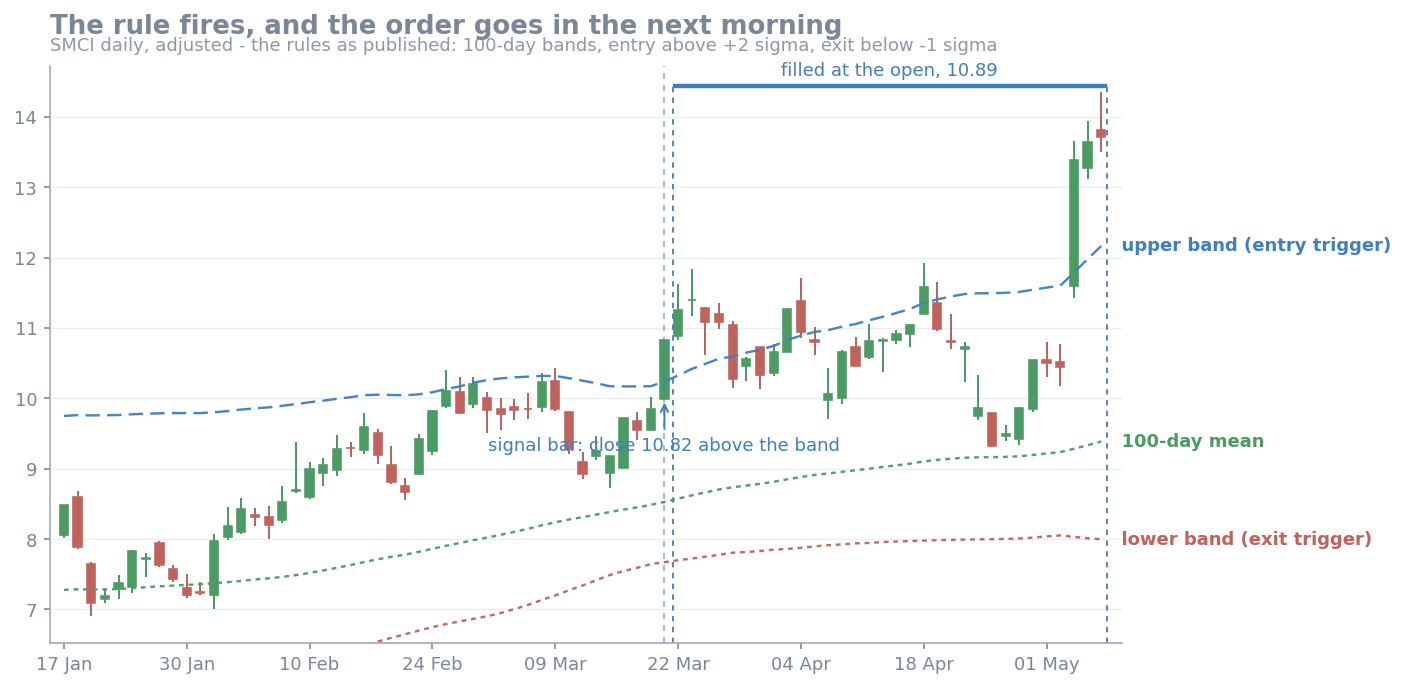
That position was closed on 27 October 2023 when price finally shut below the lower band, at 24.80 — up 128% after 219 trading days. It is the system working exactly as designed: one entry, no management, one exit, seven months apart.
I ran it — and the fill rule mattered more than the strategy
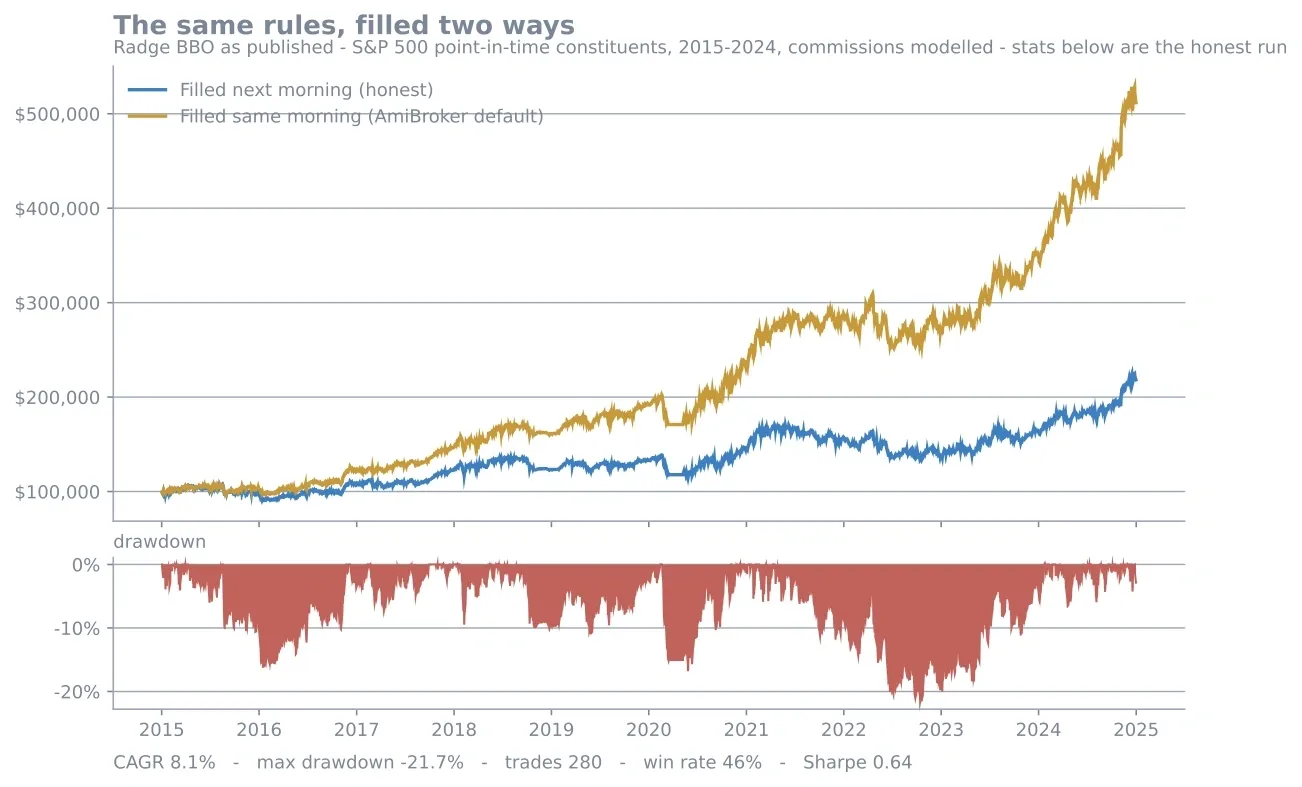
I ported the published rules to my own backtest engine and ran them on S&P 500 constituents as they existed on each day, 2015 to 2024, with commissions modelled. One deviation from the book, disclosed: 2 standard deviations for entry rather than 3. Radge’s 3σ was set for Australian small caps; on US large caps that threshold fires almost never. The AmiBroker formula that ships alongside the book makes the same adaptation.
Then I ran it a second time, changing nothing except when the order fills.
| Filled next morning | Filled same morning | |
|---|---|---|
| CAGR | 8.1% | 17.7% |
| Max drawdown | 21.7% | 18.3% |
| Win rate | 45.7% | 55.4% |
| Payoff ratio | 2.47 | 3.28 |
| Sharpe | 0.64 | 1.15 |
| Return / max drawdown | 0.37 | 0.97 |
Same rules. Same data. Same period. More than double the compound return.
The difference is that the second run buys at the opening price of the very bar whose closing price triggered the signal. You cannot do that. The close has not happened yet when the open prints. It is look-ahead, plainly — and it is what you should watch out for in AmiBroker 😄 and what it does by default when a formula does not call SetTradeDelays.
These are backtests I ran on my own machine, described so you can check them — not a recommendation, and not a forecast.
Where my numbers land against the book’s
Two of them match closely enough to suggest the port is faithful: the book reports a 47% win rate and roughly 32 trades a year; the honest run gives 45.7% and 28. The rest diverges, and the reasons are mundane — a different market, a different decade, and 2σ instead of 3σ.
One divergence is worth naming. The book reports a maximum drawdown of 41% and calls it “on the uncomfortable side”; my run drew down 21.7%. That is not the strategy being safer than advertised. It is the S&P 500 being a tamer universe than ASX small caps, in a decade with one short crash and a lot of trend.
What to take from it
Split your entry and exit thresholds, and check which one is load-bearing. Radge’s exit sits a standard deviation below the mean while the entry sits two above it, and the reasoning is explicit: a mean-crossing exit gets shaken out by ordinary noise. In the run above, positions were held an average of 174 trading days — eight months. A tighter exit would have cut every one of those winners short, and the payoff ratio of 2.47 is where all the profit lives, because the win rate never gets above 46%.
Filter entries on the broad market, and leave your exits alone. The book’s index filter blocks new entries when the index is below its 75-day average and does nothing to open positions. On Radge’s own numbers that dropped max drawdown from 43.7% to 32.6% and lifted the return-to-drawdown ratio from 0.77 to 0.92, by removing about 15% of the trades — the ones taken against the broad trend. The asymmetry is the point: bad conditions are a reason not to start something new, not a reason to abandon what is already working.
Rank your candidates when there are more signals than slots. With twenty slots and a universe of 500, oversubscribed days are the norm, and whatever breaks the tie is silently a part of your strategy. Radge ranks by how far price has stretched beyond its own mean. It is a defensible choice for a momentum system; the indefensible thing is not choosing, and letting alphabetical order pick your portfolio.
Read the footnotes on the test universe before you trust any published backtest — including this one. More on that below.
What to leave
The headline CAGR, because the universe was survivorship-biased and the book says so itself. Unholy Grails has an excellent section on survivorship bias explaining precisely how testing on today’s index members inflates results. “ASX100 being the current constituent list as at June 30th 2011. Does not include delisted stock data.” Radge is upfront about the limitation and explains that point-in-time constituent lists were not obtainable in 2012 — which was true then and is not true now. It is an honest constraint of its era, and it means the numbers in the tables are ceilings, not expectations.
AmiBroker’s default trade delay. Covered above; it is the single most consequential line of code that isn’t in the book’s formula.
The assumption that 3σ travels. A threshold calibrated on Australian small caps produces almost no signals on US large caps. Any parameter expressed in standard deviations is a statement about the volatility of the market it was fitted to, and it does not port unexamined — which the book’s own AmiBroker formula quietly acknowledges by using 2σ for US data.
The drawdown figures as a guide to what you’d feel. The book’s 41% and my 21.7% describe two different universes in two different decades. Neither is a forecast of the third one you’d actually trade.
Verdict
Worth it. Maybe not for the systems — they are simple enough to describe in a paragraph each, and this review just described one of them. Worth it for the discipline on display: eight strategies tested the same way, every number published, a whole chapter on the ways a backtest can flatter you, and footnotes honest enough that a careful reader can find the limitation the author is working around.
Read it if you want a model of how to evaluate a trading idea. Skip it if you want the rules and nothing else — those fit on an index card, and half of them are in this article.
The part I actually took away wasn’t a strategy. It was that the book warns about survivorship bias in one chapter and then, sixty pages later, has to test on a survivorship-biased universe because nothing better existed in 2012. Everyone’s data has a version of that limitation. The only question is whether you know which one is yours.
Sources
- Radge, N. Unholy Grails: A New Road to Wealth (2012) — Bollinger Band Breakout, pp.129–136; survivorship bias, pp.49–50; strategy comparison, pp.137–138; test universe, footnote 28.
- Own backtest, honest fill — the book’s rules, 100-day bands, 2σ entry / 1σ exit, S&P 500 point-in-time constituents, 2015-01-01 to 2024-12-31, 20 positions at 5% each, commissions modelled, next-open fills. 280 trades.
- Own backtest, same-bar fill — identical, but with AmiBroker’s default delay-0 open fill. 327 trades.