
A four-ETF momentum rotation (SPY, TLT, DBC, GLD): the S&P 500's return with half its worst fall, and a ten-year wait
The short version
| What it does | Once a month it looks at four funds: US stocks (SPY), long-term Treasury bonds (TLT), commodities (DBC) and gold (GLD). It holds the two that rose most over the past year, but only while each is above its own 10-month average. Otherwise that half of the money waits in cash. |
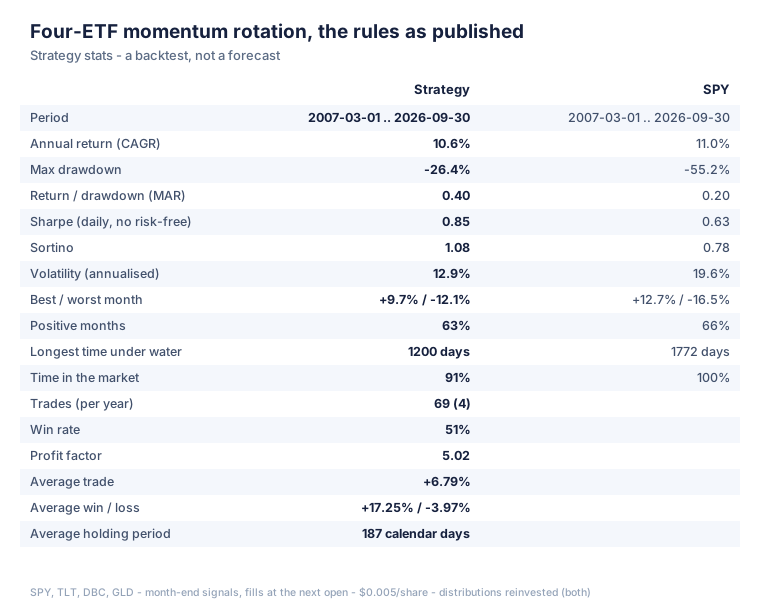
| What it made | 10.57% a year from March 2007 to September 2026, against 11.04% for SPY bought and held. Both with dividends and bond interest reinvested. |
| What it cost | At its worst it was 26.4% below its previous high. SPY's worst fall was 55.2%. |
| The test that mattered | I rebuilt it 300 times with the two funds picked by dice from those above their average. Only 5 of the 300 did as well. |
| The catch | From 2010 to 2019 it made 4.89% a year while SPY made 13.26%. Its longest stretch below a previous high lasted 3.3 years. |
| Verdict | The rules work. Alone they are very hard to sit through. Half of an account, next to SPY, is where they earned their keep. |
Everything below is a backtest of published rules on past prices. It is a record of what I measured, not advice and not a recommendation to trade anything.
What this is, and what it isn't
This is a rotation strategy. It owns at most two of four very different assets and switches between them once a month. Two ideas drive it. Trend: stay out of anything that is falling. Momentum: of what is rising, own what has risen most, on the bet that strength lasts a few more months.
It did not beat the stock market on return. Over almost twenty years it came within half a point a year of it, with half the worst fall. The "worst fall", or drawdown, is the deepest drop from a peak in the account to the low that follows.
It got there by taking turns with the market. It was far ahead after 2008, spent a whole decade falling behind, and caught up after 2020. That middle decade is the real subject of this review.
Where it came from
The rules come from a TradingwithRayner website and YouTube channel.
The idea is old and heavily mined. Mebane Faber's 10-month moving-average rule for asset classes was published in 2007. Gary Antonacci's dual momentum is the same family. So the question is not whether the idea is clever. It is whether it survives an honest test.
The rules
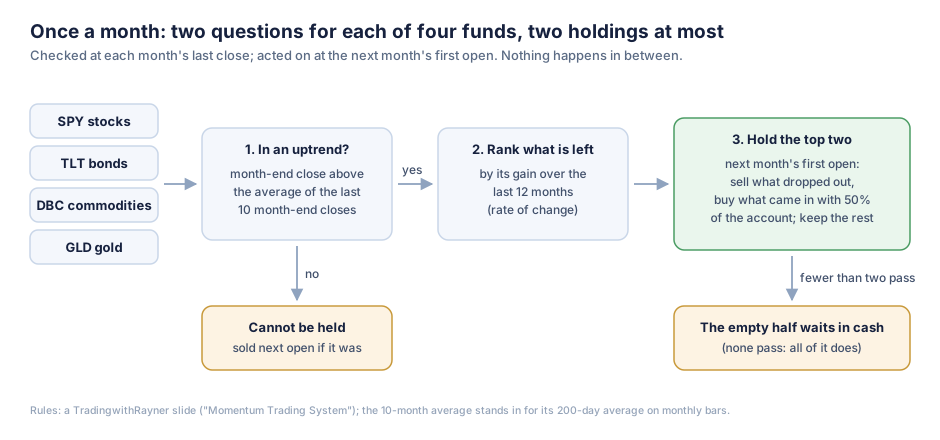
At each month's last close, every fund faces the same two questions. Is it above the average of its last 10 month-end closes? And among those that are, which two rose most over the last 12 months? Those two are next month's holdings. At the next month's first open, a fund that dropped out is sold, and a newcomer is bought with half of the account.
The rules in full, precise enough to rebuild
- The funds. SPY, TLT, DBC and GLD, nothing else. DBC started trading in February 2006, so the test starts in March 2007, the first month all four have a full year of history.
- The trend test. The month-end close is above the simple average of the last 10 month-end closes. The slide says 200-day average. On monthly bars there are no days to average, and 200 trading days is about 9.5 months, so 10 months is the usual stand-in.
- The ranking. The percentage change of the month-end close over 12 months. Only funds that pass the trend test are ranked.
- Holdings. The two highest. If only one fund passes, the other half of the money stays in cash. If none pass, all of it does.
- Orders. Decided at a month's last close, filled at the next month's first open. A holding that stays in the top two is kept as it is. It is not trimmed back to 50% every month (the stress table shows that version too).
- Size. 50% of the account's value at the moment of buying. Nothing is borrowed.
- Costs. Half a cent a share in commission. The base run adds no slippage, the gap between the expected price and the one you get, and pays no interest on idle cash.
- Prices. The signals read ordinary price charts, adjusted for splits. The money includes the dividends and bond interest an owner of these funds receives, reinvested. SPY, the benchmark, is treated the same way.
One real trade, start to finish
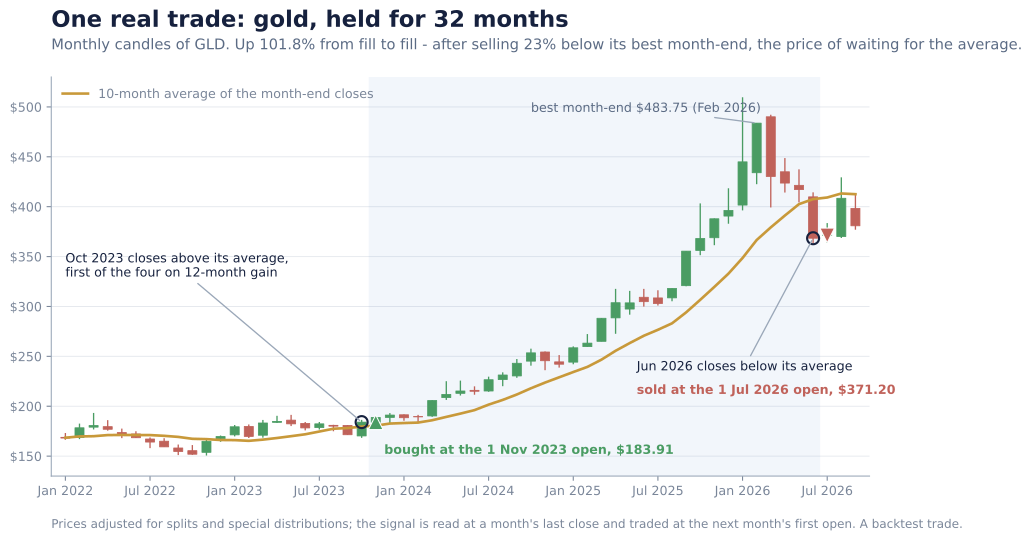
Gold closed October 2023 at $184.09, above its 10-month average of $179.57. It had risen 21% in a year, more than any of the other three funds. So GLD was bought at the open on 1 November 2023, at $183.91.
Then it was simply held. Gold stayed above its average and near the top of the ranking for 32 months. Its best month-end was $483.75, in February 2026. By June 2026 it had fallen to $368.38, below its average of $407.59. GLD was sold at the open on 1 July 2026, at $371.20.
That is a gain of 101.8%. It also shows the cost of the method. The rule looks once a month at a slow average, so it sold 23% below the best month-end. A monthly trend rule never sells near the top. It gives back part of every big move before it admits the move is over.
What it did over 19.6 years
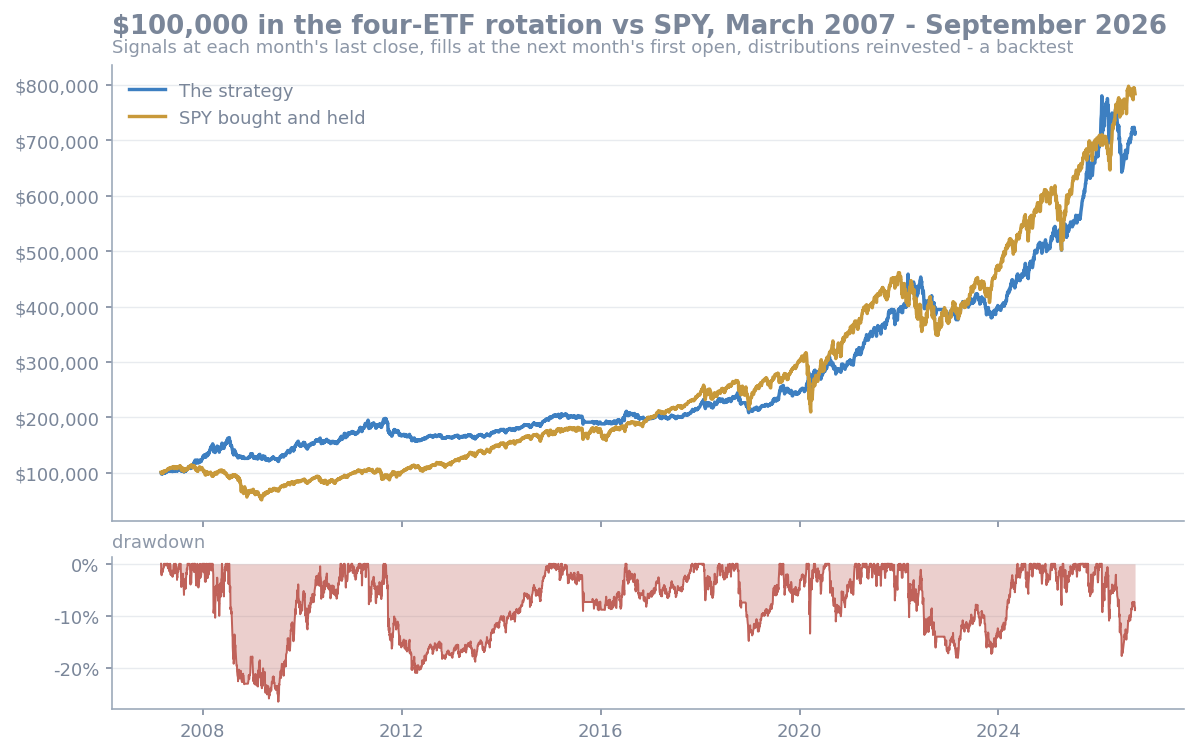
The test runs from March 2007 to September 2026 with $100,000. Orders go in at the next month's open, at half a cent a share, and the strategy made 69 trades. SPY is bought on the first day and never sold. Both reinvest their distributions. This is a backtest, not a live record.
| Over 19.6 years | The strategy | SPY, bought and held | The four funds, 25% each | 60% SPY, 40% TLT |
|---|---|---|---|---|
| $100,000 became | $713,229 | $784,051 | $399,217 | $475,676 |
| Return a year | 10.57% | 11.04% | 7.32% | 8.29% |
| Worst fall from a peak | 26.42% | 55.16% | 27.67% | 31.02% |
| Sharpe ratio | 0.85 | 0.63 | 0.75 | 0.77 |
Sharpe compares the return with how bumpy the ride was: higher means the same gain arrived more smoothly. The two right-hand columns are rebalanced every month.
The rules did beat their own ingredients. Holding all four funds in equal parts made 7.32% a year with about the same worst fall. Choosing two of them each month added more than three points a year.
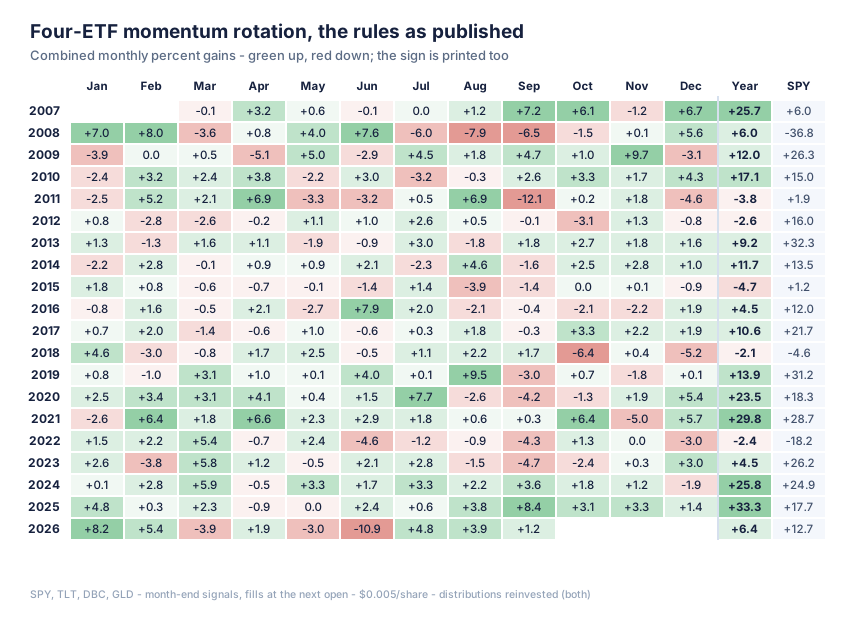
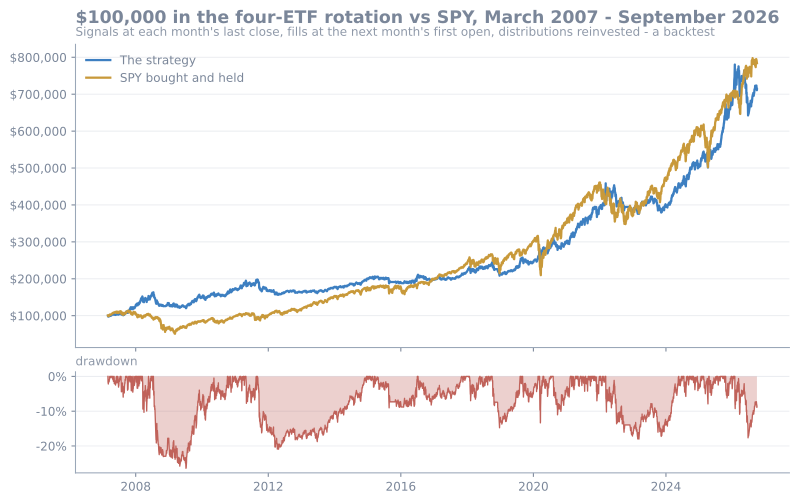
The equity chart tells the story in three acts.
| Period | The strategy, a year | SPY, a year |
|---|---|---|
| March 2007 to 2009 | +15.15% | −5.71% |
| 2010 to 2019 | +4.89% | +13.26% |
| 2020 to September 2026 | +17.02% | +15.10% |
The first act is 2008. The strategy made 6.0% that year while SPY lost 36.8%. It held gold, commodities and then bonds while stocks fell. That is where its whole lead came from.
The second act is long. From the market's low in March 2009, SPY grew 15.4 times by September 2026. The strategy grew 5.6 times. In the 2010s it held SPY on 68% of days, but never with more than half the money. The other half rotated between gold, bonds and commodities, and commodities lost money over the decade. Its worst fall in those ten years was 20.93%, about the same as SPY's 19.34%, for about a third of the return.
The third act starts in 2020, when gold, commodities and stocks all had strong runs. The strategy finished ahead of SPY in 8 of the 19 calendar years from 2008. The full-period numbers hide how unevenly those years were spread.
What I tried to break
Every run is in the table below, including the ones that did better than the published rules. MAR is the return a year divided by the worst fall, so higher is better. A basis point is one hundredth of one percent of the price.
The full stress battery - 36 rows
| Group | Run | Return a year | Worst fall | MAR | Trades |
|---|---|---|---|---|---|
| The rules | The rules as published (base) | 10.57% | 26.42% | 0.40 | 69 |
| Benchmark | SPY bought and held (total return) | 11.04% | 55.16% | 0.20 | |
| Benchmark | The four ETFs, 25% each, rebalanced monthly | 7.32% | 27.67% | 0.27 | |
| Part of a bigger book | 50% strategy + 50% SPY, rebalanced monthly | 11.26% | 34.58% | 0.33 | |
| Part of a bigger book | 33% strategy + 67% SPY, rebalanced monthly | 11.29% | 40.36% | 0.28 | |
| Benchmark | 60% SPY + 40% TLT, rebalanced monthly | 8.29% | 31.02% | 0.27 | |
| Data | Prices without distributions (a plain price-chart backtest) | 9.58% | 27.14% | 0.35 | 69 |
| Data | Signals on total-return prices too | 10.29% | 23.15% | 0.45 | 71 |
| Costs | Slippage 1 bp per side | 10.53% | 26.45% | 0.40 | 69 |
| Costs | Slippage 3 bp per side | 10.47% | 26.51% | 0.40 | 69 |
| Costs | Slippage 5 bp per side | 10.39% | 26.55% | 0.39 | 69 |
| Costs | Slippage 10 bp per side | 10.22% | 26.70% | 0.38 | 69 |
| Idle cash | Idle cash in short Treasuries (SHV) | 10.70% | 26.04% | 0.41 | 69 |
| Fills | Filled at the signal month's last close | 11.17% | 23.89% | 0.47 | 69 |
| Fills | Filled at the 5th trading day's open | 11.13% | 29.42% | 0.38 | 69 |
| Sizing | Every holding re-sized to 50% each month | 10.61% | 25.64% | 0.41 | 69 |
| Rules | No trend filter: always the top 2 by 12-month gain | 10.18% | 37.23% | 0.27 | 55 |
| Positions | 1 position (100%) | 10.81% | 35.93% | 0.30 | 60 |
| Positions | 3 positions (33% each) | 8.15% | 20.19% | 0.40 | 70 |
| Positions | 4 positions (25% each): every ETF above its average | 6.41% | 16.22% | 0.40 | 72 |
| Trend average | Trend average 6 months | 11.91% | 21.21% | 0.56 | 90 |
| Trend average | Trend average 8 months | 11.91% | 28.57% | 0.42 | 74 |
| Trend average | Trend average 9 months | 11.27% | 26.74% | 0.42 | 67 |
| Trend average | Trend average 11 months | 9.95% | 25.82% | 0.39 | 63 |
| Trend average | Trend average 12 months | 9.57% | 27.51% | 0.35 | 65 |
| Trend average | Trend average 14 months | 9.78% | 32.29% | 0.30 | 64 |
| Momentum window | Momentum measured over 3 months | 10.04% | 26.52% | 0.38 | 99 |
| Momentum window | Momentum measured over 6 months | 11.14% | 26.75% | 0.42 | 75 |
| Momentum window | Momentum measured over 9 months | 9.62% | 26.38% | 0.36 | 69 |
| Momentum window | Momentum measured over 11 months | 10.10% | 26.46% | 0.38 | 71 |
| Momentum window | Momentum measured over 13 months | 10.08% | 26.36% | 0.38 | 71 |
| Momentum window | Momentum measured over 15 months | 9.57% | 26.43% | 0.36 | 71 |
| Momentum window | Momentum measured over 18 months | 9.36% | 26.57% | 0.35 | 73 |
| Settings grid | All 192 pairs of trend average 3-14 months x momentum 3-18 months: lowest / middle / highest | 7.15% / 9.94% / 12.83% | 19.38% / 26.38% / 32.51% | 0.26 / 0.37 / 0.60 | |
| Dice control | Dice pick among the ETFs above their average (300 runs): middle / best | 8.58% / 11.28% | 26.36% / - | 0.33 / - | 137 (middle) |
| Dice control | Dice pick any two of the four, no filter (300 runs): middle / best | 6.96% / 11.92% | 34.50% / - | 0.20 / - | 235 (middle) |
The dice test, the run that could have killed it. The trend filter decides when a fund may be owned. The ranking decides which two. To see whether the ranking carries information, I kept everything else and let dice choose. The first 300 versions keep the trend filter, and dice pick two of the funds above their average. The next 300 drop the filter, and dice pick any two of the four.
| What chose the two funds | Middle run | Best run | Runs that did as well as the rule |
|---|---|---|---|
| Dice, among funds above their average | 8.58% | 11.28% | 5 of 300 |
| Dice, any two of the four | 6.96% | 11.92% | 9 of 300 |
| The real rule: the two strongest | 10.57% |
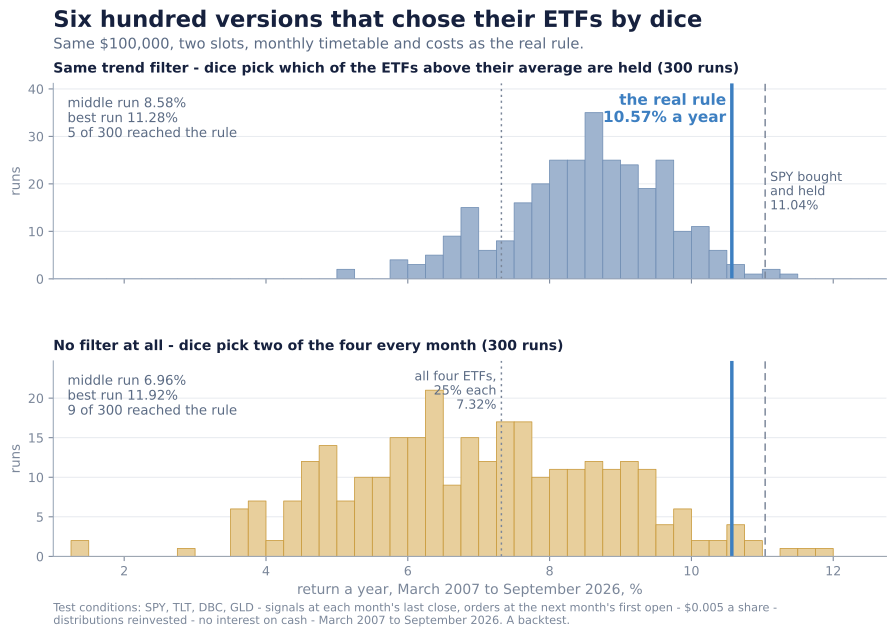
The ranking is worth about two points a year over the middle dice run. The filter does a different job. With it, the middle dice run fell 26.36% at worst, almost exactly like the real rule. Without it, the middle dice run fell 34.50%. The ranking earns the return and the filter limits the damage.
What survives
The ranking is real. Only 5 of 300 dice versions, with the same filter, did as well as picking the two strongest funds.
The settings are not on a knife edge. I ran every pair of trend average from 3 to 14 months and momentum window from 3 to 18 months, 192 in all. They returned between 7.15% and 12.83% a year, 9.94% in the middle. The published 10 and 12 ranked 58th of 192. Every one of the 192 had a better MAR than SPY's 0.20.
Costs and timing are not the weak spot. Ten basis points lost on every order cost 0.35 of a point a year. Filling at the signal month's close made 11.17%, and waiting until the fifth trading day made 11.13%. Earning short-term Treasury interest on idle cash added only 0.13 of a point, because 91% of the money was invested on an average day.
The filter took eleven points off the worst fall. Without it, always holding the two strongest funds, the worst fall grew from 26.42% to 37.23%. The return slipped only from 10.57% to 10.18%.
What breaks
It needs a bad year for stocks to pay off. All of its lead over SPY was built in the 2008 crash. It was ahead of SPY on only 54.3% of days, and the last of them was 12 May 2026. In a decade of rising stocks it made 4.89% a year. Anyone who judges it against the S&P 500 every month will want to quit somewhere in the 2010s.
The dry spells are long. It went 3.3 years below a previous high, from September 2011 to December 2014, while SPY was setting new highs. From March 2022 to May 2024 it spent another 2.2 years below its high, and SPY recovered five months sooner. This is the cost that a single return figure hides.
Two positions are a concentrated bet. Each holding is half of the account. With one position the worst fall grew to 35.93%. With three it shrank to 20.19%, and so did the return, to 8.15%. Gold alone was held on 57% of all days. A long run in one asset can carry the result, as it did from 2024 to 2026.
The result depends on counting the distributions. On price charts alone, without dividends and bond interest, the same trades made 9.58% a year. A simple chart backtest of these rules will understate them by about a point a year.
Verdict
The rules work. Picking the two strongest of four funds in an uptrend beat dice, beat holding all four, and took the stock market's return with half its worst fall. That is a real result from a one-page rulebook.
It is also very hard to run alone. The test holds one decade in which it trailed stocks by more than eight points a year, and in that decade its falls were as deep as the market's. Few people keep following rules through ten years like that, whatever the backtest says.
It works much better as one part of a larger portfolio. Its monthly returns moved only loosely with SPY's, with a correlation of 0.32. So half of each, rebalanced monthly, beat both on smoothness:
| Over 19.6 years | Return a year | Worst fall | Longest below a high | Sharpe |
|---|---|---|---|---|
| The strategy alone | 10.57% | 26.42% | 3.3 years | 0.85 |
| SPY alone | 11.04% | 55.16% | 4.9 years | 0.63 |
| Half each, rebalanced monthly | 11.26% | 34.58% | 2.4 years | 0.91 |
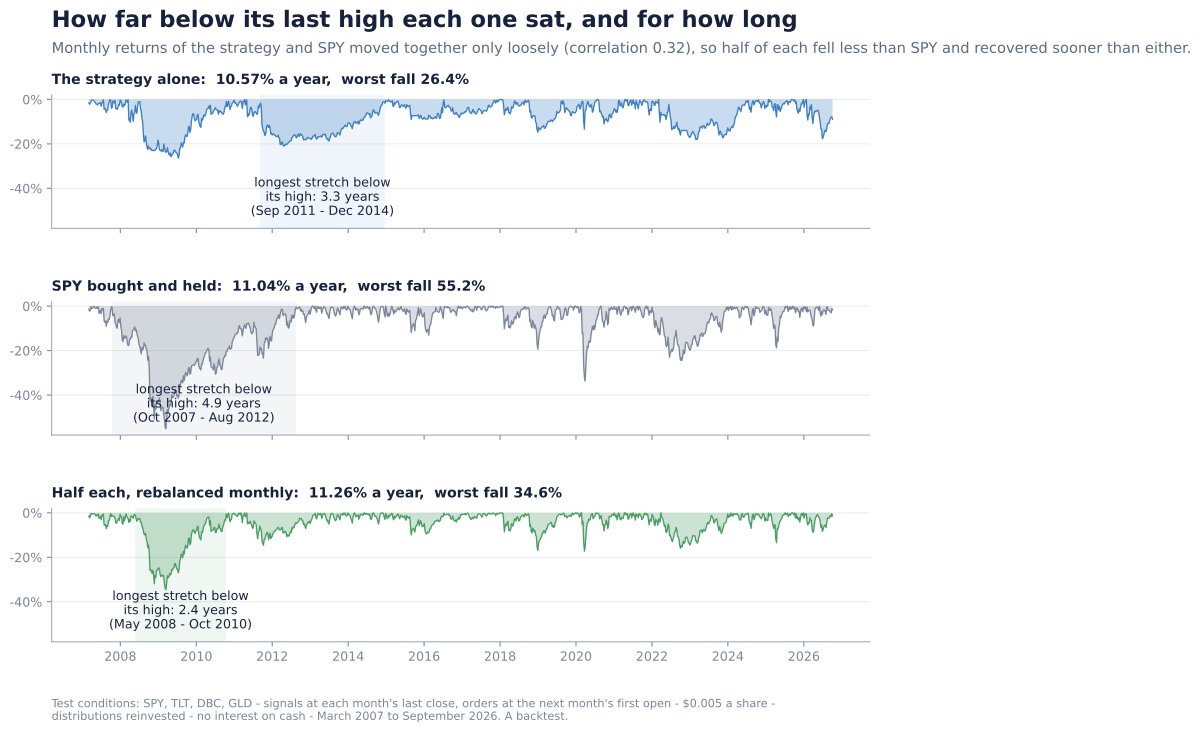
This suits someone who already owns stocks and wants a part of the account that does not fall with them. It does not suit someone who wants to beat the S&P 500, or who checks the comparison every month.
The trading formula, a stand-alone Python and AFL versions that reproduces every trade above, and the measurements behind the portfolio mix are on Patreon: patreon.com/cw/SimpleStockTrade.