
The Golden Cross: does it still work? 98 years of the 50/200 rule, tested
The short version
- The rule: own the S&P 500 while its 50-day average price is above its 200-day average. Sit in cash while it is below.
- On SPY since 1993, dividends included: 9.9% a year, against 10.9% for simply holding. Its worst fall was 34%, against 55%.
- It is out of the market about one day in four, and it trades about once every two years.
- Since 1928 it beat holding in the decades with long bear markets (the 1930s, the 1970s, 2000-2012). It lost in the bull decades, including 2013-2026.
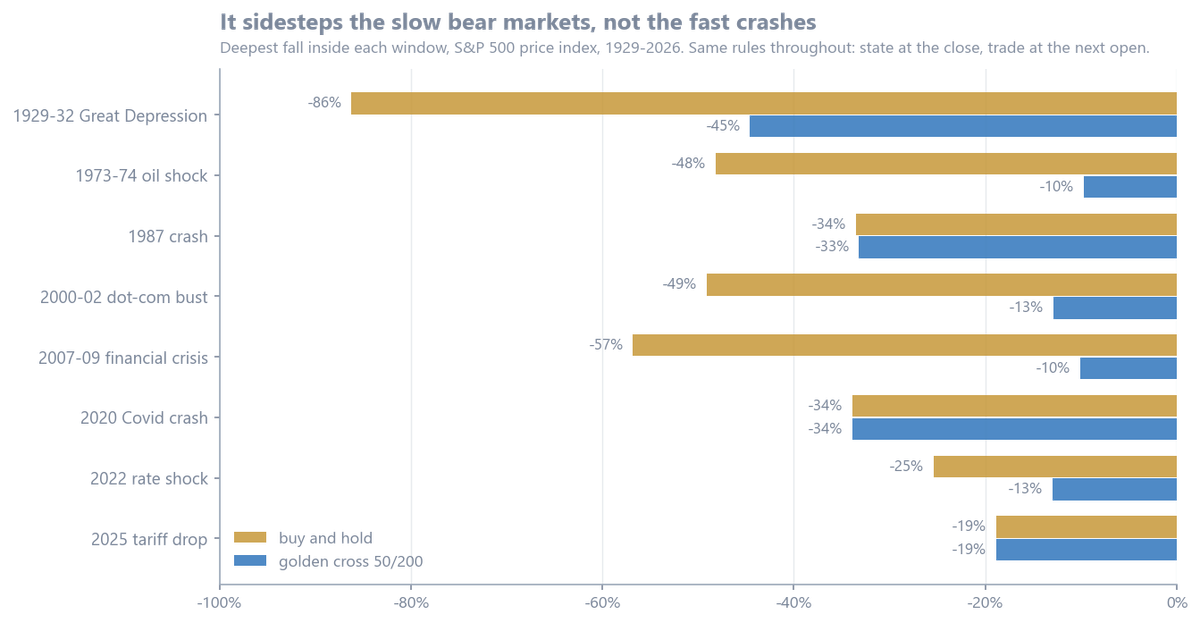
- It does nothing against fast crashes. 1987, 2020 and 2025 hit it as hard as the index.
- Verdict: the signal is real, but it is insurance, not extra return. Since 2013 the insurance cost about 4 points a year.
What this is
The golden cross is the most quoted signal in market commentary. When the S&P 500's 50-day moving average (the average of the last 50 closing prices) crosses above its 200-day average, the market is said to be in an uptrend. When it crosses back below, that is the "death cross". The trading rule is as simple as rules get: be invested after a golden cross, be in cash after a death cross.
It is a trend-following bet. It does not try to buy low. It tries to be absent for the worst part of a long decline, and accepts being late at both ends to do that.
The finding, up front. It does not beat buy-and-hold on return. What it does is cut the worst fall (the drawdown, measured from a previous high) by about a third, and in slow bear markets by far more: 2008 cost it 10%, against 57% for the index. Beating the market on return and beating it on drawdown are different products. This is the second kind.
Where it came from
The 50/200 pairing has been in market commentary for decades and appears in most introductory trading books. A card that keeps circulating on social media claims it beat buy-and-hold on the S&P 500 from 1990 to 2022, at 8.8% a year against 7.4%.
I could reproduce both numbers, and that is the problem. The 8.8% is the strategy with dividends reinvested. The 7.4% is the index without dividends. Compared fairly, the order flips:
| 1990-2022 | Golden cross | Holding the index |
|---|---|---|
| Both with dividends | 8.7% a year, worst fall -34% | 9.7%, worst fall -55% |
| Both without dividends | 7.0% | 7.4% |
So I started again from the rules.
The rules, exactly
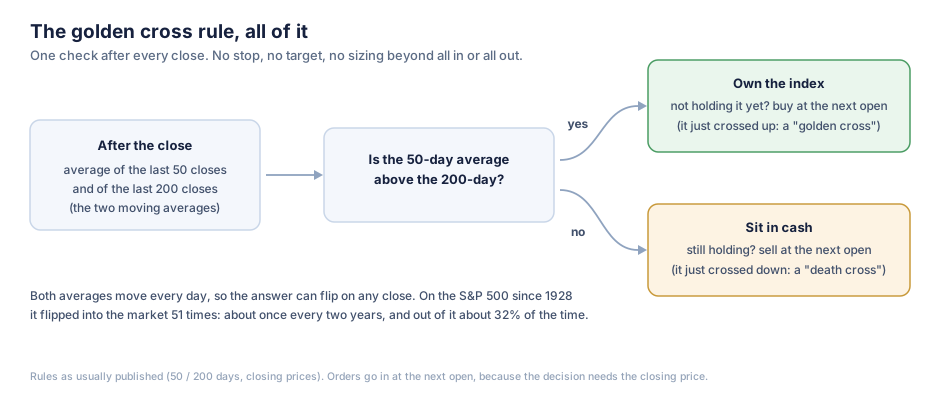
- After each close, compute the 50-day and 200-day simple moving averages of the closing price.
- If the 50-day is above the 200-day, hold the index. If not holding, buy at the next open.
- If it is below, hold cash. If holding, sell at the next open.
- All of the money is in or all of it is out. There is no stop and no target.
- My test: $100,000 start, whole shares, $0.005 per share commission each way. Cash earns nothing unless a row says otherwise.
Orders go in at the next open because the decision needs the closing price. Filling at that same close instead made no difference (9.85% a year against 9.89%).
Where the orders actually go
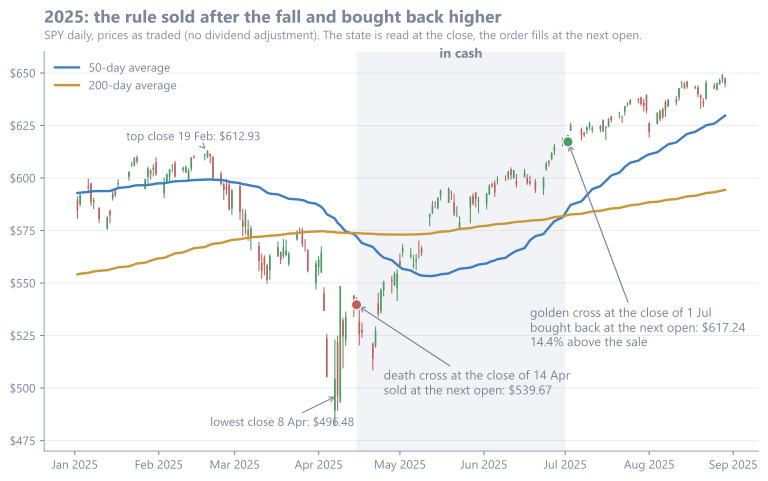
The 2025 sell-off shows the rule's personality. SPY closed at a top of $612.93 on 19 February and at its lowest, $496.48, on 8 April. The averages only crossed down at the close of 14 April, after the low, and the rule sold at the next open for $539.67.
They crossed back up at the close of 1 July, and the rule bought at $617.24 the next morning, 14.4% above its own sale. In 2025 the strategy made 2.6% while SPY made 17.7%. A slow signal is late out and late back in. It only pays when a decline lasts long enough for being late to still be early.
I ran it
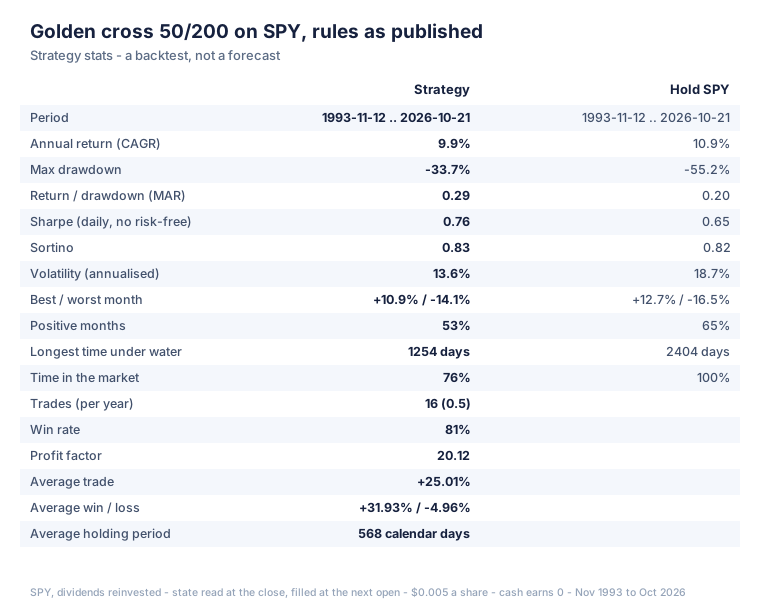
On SPY with dividends reinvested, from November 1993 (the first day both averages exist) to October 2026, the rule returned 9.9% a year against 10.9% for holding. $100,000 grew to $2.24 million against $2.98 million.
The other side of that point a year is the drawdown row: a worst fall of 34% against 55%. Its longest stretch below a previous high was 1,254 days, against 2,404. Thirteen of its 16 trades made money, but the average trade lasted about a year and a half, so the win rate says little.
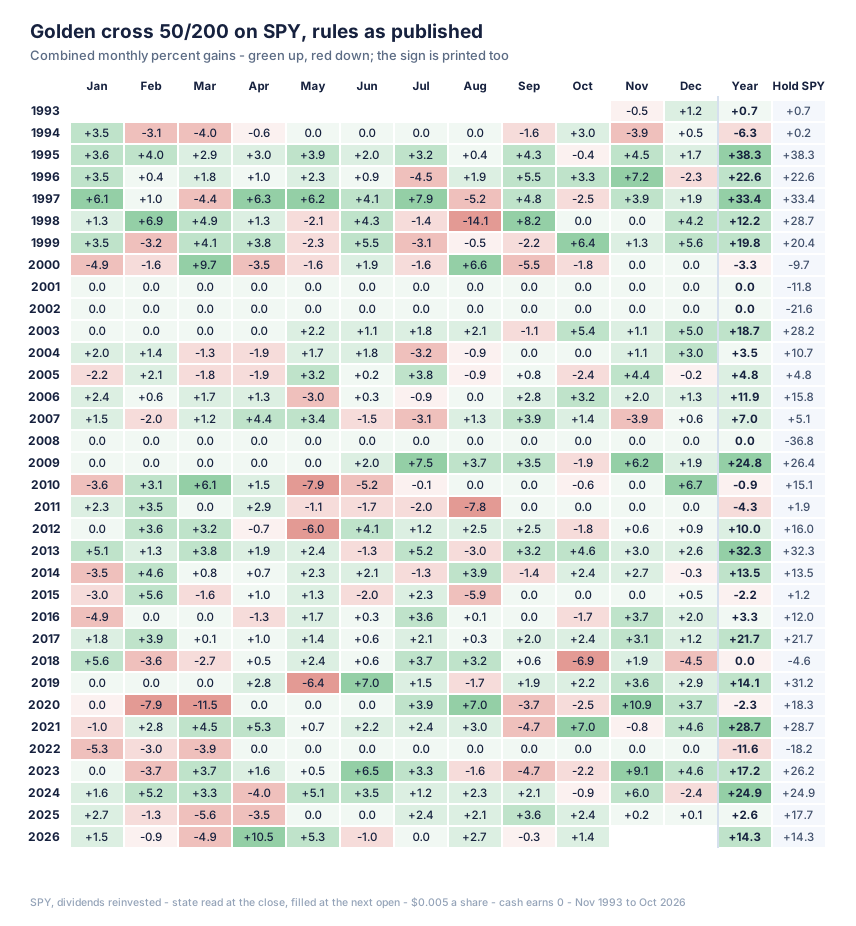
The rows of zeros are the cash years: all of 2001, 2002 and 2008, when the index lost 11.8%, 21.6% and 36.8%. The weak years follow false alarms, like 2010, 2016 and 2025, when the rule sat in cash through a recovery.
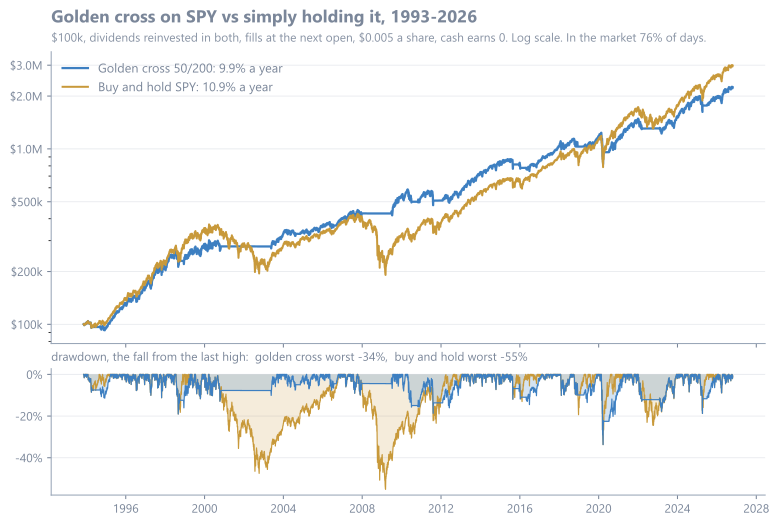
The rule fell behind in the late 1990s, took the lead in April 2002 and held it until April 2020. Its worst fall came in March 2020, as deep as the index's. That crash was over before the averages could cross.
Does it still work?
For an answer that is not about one lucky decade, I ran the same rules on the S&P 500 index back to 1928. Before March 1957 the series is the index's predecessor, the S&P index of 90 stocks. It has no dividends, so both columns leave them out.
| Era | Golden cross: a year / worst fall | Holding: a year / worst fall | Time in the market |
|---|---|---|---|
| 1928-1949 | 2.2% / -52% | -1.2% / -86% | 53% |
| 1950-1979 | 6.6% / -18% | 6.4% / -48% | 67% |
| 1980-1999 | 10.6% / -33% | 14.1% / -34% | 80% |
| 2000-2012 | 4.2% / -20% | -0.2% / -57% | 60% |
| 2013-2026 | 8.9% / -34% | 12.9% / -34% | 83% |
| All 98 years | 6.4% / -52% | 6.2% / -86% | 68% |
The pattern is consistent, and it is not the rule breaking down. It wins when the market spends years going down and loses when it spends years going up. 2013-2026 was the second kind. On SPY with dividends, those years gave 10.4% a year against 14.8%, with the same worst fall.
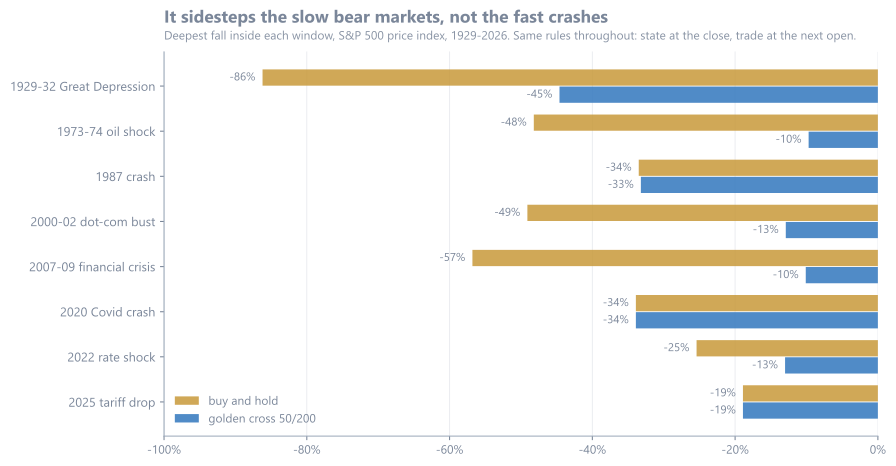
Bear markets that unfold over months give the averages time to cross: 1929-32, 1973-74, 2000-02, 2007-09 and 2022. In those the rule lost a fraction of what the index lost. Crashes that happen in weeks are over before the 50-day average has moved: 1987, 2020 and 2025. So yes, it still works. It does what it always did, and the last decade did not need it.
What I tried to break
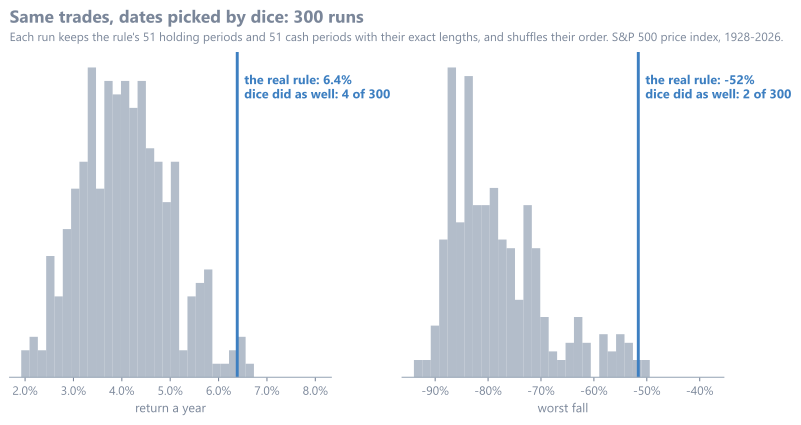
The rule spends a third of the time in cash. Maybe anything that sits out a third of the time does as well? To check, I kept its 51 holding periods and 51 cash periods with their exact lengths and shuffled their order, 300 times. Same trades, same time in the market, random dates.
Over 98 years the random runs returned a median of 4.0% a year. Only 4 of 300 matched the real 6.4%, and only 2 of 300 fell less. The cross really does tend to be out at bad times.
| Test | Result | What it means |
|---|---|---|
| Two halves of the SPY test | 1993-2010: 11.0% vs 7.6% holding. 2010-2026: 8.7% vs 14.1% | Won the half with two bear markets, lost the half without |
| 41 other average pairs, 20-100 / 100-300 days, SPY | 6.6% to 11.0% a year. None beat holding. All 41 fell less (-28% to -38%) | 50/200 ranks 9th of 41. Nothing special, nothing fitted |
| The same 41 pairs, 1929-2026 | 4.2% to 6.4%. 7 of 41 beat holding | The protection holds for every pair |
| Extra trading cost, 0 to 25 hundredths of a percent per trade | 9.9% to 9.6% a year | One trade every two years: costs barely matter |
| Fill at the signal day's close instead of the next open | 9.85% vs 9.89% | The fill assumption is not driving it |
| Cash earns a T-bill fund, 2007-2026 | 8.8% to 9.1% a year (holding: 10.7%) | Rates were near zero for most of it. Each 1% of yield adds about a quarter point |
| Dates shuffled 300 times, 1928-2026 | Median 4.0%. 4 of 300 matched 6.4% | The timing carries information |
| Dates shuffled 300 times, SPY 1993-2026 | Median 7.9%. 24 of 300 matched 9.9%, 5 of 300 fell less | Same, on a shorter history |
What happens if you trade it on stocks?
The obvious next idea: apply the cross to each stock. Buy a stock on its own golden cross, sell it on its death cross. I tested it on the S&P 500 members as of each day, so stocks that later dropped out or went bust are included. Up to 20 positions of 5% each, a $5+ price and $5M+ of daily turnover, fills at the next open. When more stocks crossed on a day than there were free places, the stronger 200-day performance won. Stock prices here exclude dividends, so the benchmark does too.
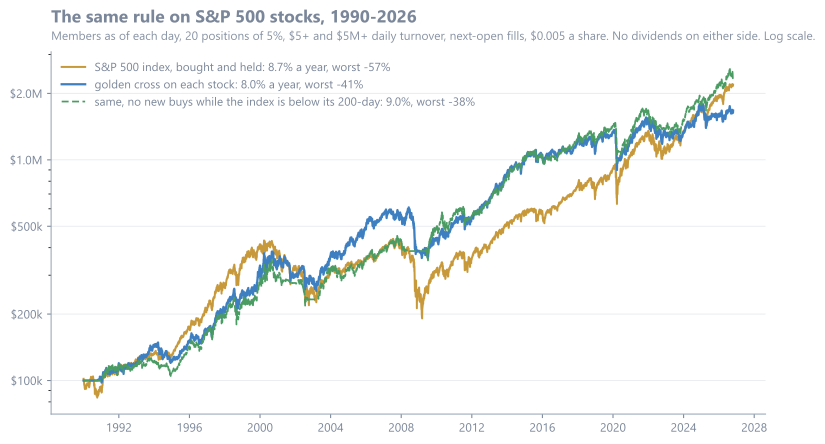
| 1990-2026 | Cross on each stock | Same, no new buys while the index is below its 200-day | Holding the index |
|---|---|---|---|
| A year / worst fall | 8.0% / -41% | 9.0% / -38% | 8.7% / -57% |
| 2000-2012 | 5.5% | 6.4% | -0.2% |
| 2013-2026 | 6.9% | 9.9% | 12.9% |
On stocks the rule stops being a market timer. Some stock is always crossing up, so the book was 95% invested on average. It becomes a picker of recent uptrends, and since 2013 its picks trailed the index by 6 points a year. The median trade lost 3.0%, and 59% of the 973 trades lost money. The average of +8.9% comes from a few big winners: 31 trades more than doubled.
Gating new buys on the index's own 200-day line helped, to 9.0% a year. I chose that variant after seeing the full history, so treat it as a lead, not a result. It still trailed the index by 3 points a year since 2013.
What survives
The timing is real. Only 4 of 300 runs with the same trades on random dates matched its 98-year return. Being out of the market a third of the time does not explain it. Being out at the right times does.
The protection holds for any sensible pair of averages. All 41 pairs from 20/100 to 100/300 days fell less than holding SPY. 50/200 is a typical member of that group, not a lucky one.
It is cheap to run. Costs of 25 hundredths of a percent per trade took 0.25 points a year.
What breaks
It does not beat holding in a bull market. Since 2013 it trailed by 4 points a year on SPY, with the same worst fall. Ten years is a long time to pay for insurance.
It does nothing against fast crashes, and it can sell near the low and buy back higher, as in 2025.
The cash and dividend assumptions decide the comparison. The test pays nothing on cash. With about 24% of days in cash, each 1% of T-bill yield is worth about a quarter point a year. Comparing a strategy with dividends against an index without them, as the card does, is a bigger error than either.
On stocks it is a different strategy: always invested, and behind the index since 2013.
Verdict
The golden cross works the way it always did: a slow insurance policy against long bear markets, backed by 98 years, 300 random controls and 41 parameter pairs.
It suits someone who could not sit through a 50% fall and accepts giving up return in good decades, with nothing back in fast crashes. It does not suit anyone expecting to beat the index. Over 98 years it roughly tied it, on SPY since 1993 it trailed by a point, and in the last decade it lost clearly.
This is a backtest of my own on historical data. It describes the past under the conditions stated, it is not a forecast, and it is not a recommendation to trade anything.